RTH gaps in Bitcoin occur between Regular Trading Hours (RTH) sessions on the CME chart. This concept has become increasingly important since Bitcoin became one of the assets offered by the CME.
With institutional participation growing, the market now reflects a broader and more structured perspective.
At Chart Champions, we closely monitor this specific chart. In this article, we’ll explain why it plays a key role in building the context for our trading sessions and even our weekly biases.
Identifying RTH Gaps in Bitcoin
To identify these gaps in TradingView, it’s essential to use a 24-hour timeframe. This setting ensures that the candles align with the CME’s RTH session, filtering out overnight activity and giving you a cleaner, institutionally driven view of the market.
Here’s a quick guide on how to add this custom timeframe in TradingView:
- Go to the Chart Interval option and click Add custom interval.
- Under Type, select Hours.
- In the Interval field, enter 24.
- Click Add.
In the following example, we can see a Bitcoin chart with the 24-hour timeframe selected. On this chart, it’s also essential to pay attention to the candle patterns, as they help us understand shifts in market sentiment.
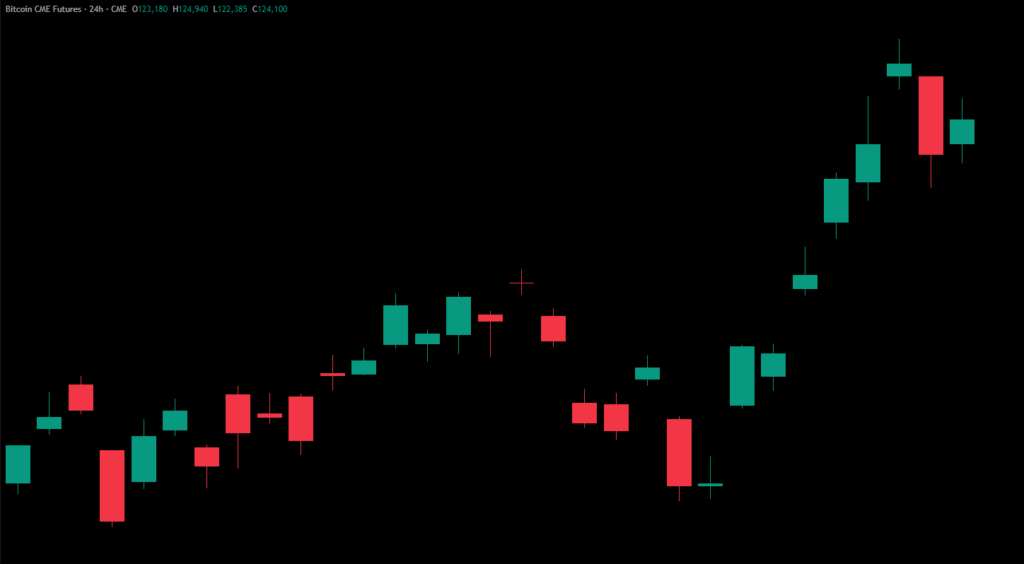
This approach enables us to view Bitcoin from the same perspective as institutional traders, aligned with the most active sessions and how they reflect shifts in sentiment or positioning. It’s a great way to build narratives and context for your higher-timeframe bias throughout the week.
Combining Candle Patterns
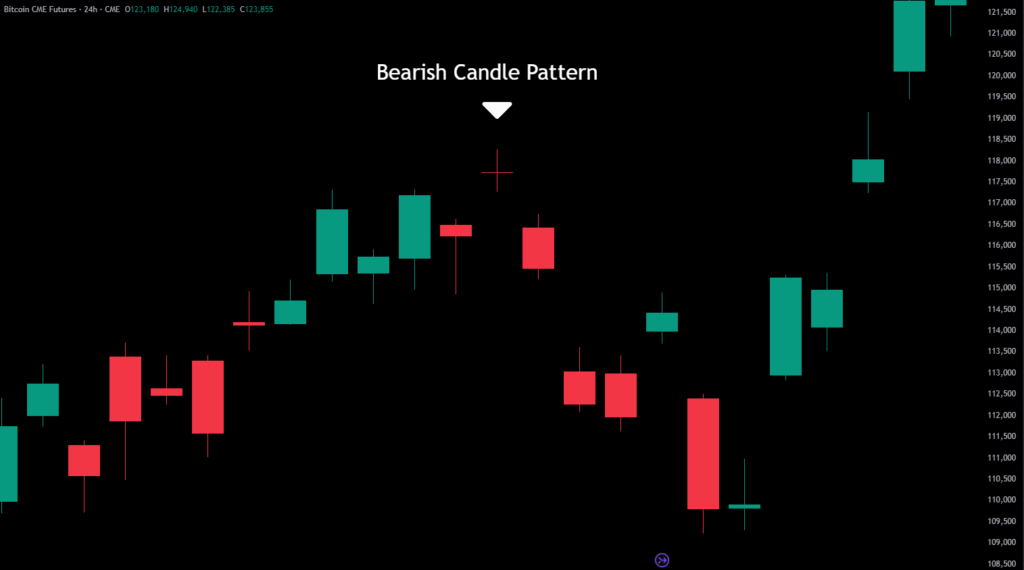
Recently, Bitcoin printed a bearish abandoned baby pattern, a rare three-candle formation often seen at market turning points. In this pattern, the candle that marks the high on the chart opens and closes at the same price level, forming a classic indecision candle pattern (+).
Following this setup, the price dropped by over 7%, perfectly highlighting the power of these high-timeframe reversal signals.
Igor explained this pattern in detail during one of our recent YouTube market updates here.
This pattern belongs to a family of three-candle formations that are commonly known as swing highs and swing lows.
These structures mark key turning points on the chart, where the market forms a significant low before moving higher or a key high before turning lower.
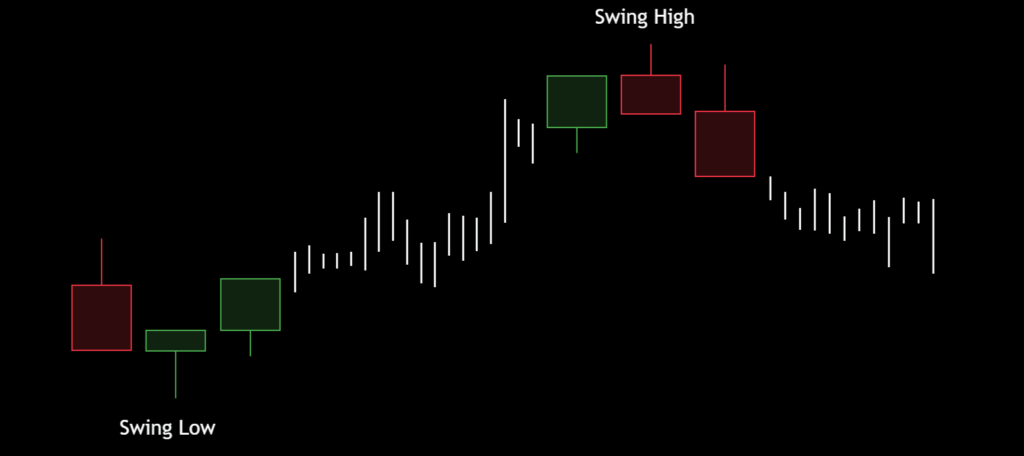
Swing Highs and Swing Lows: Spotting Key Reversals
Identifying these patterns on higher timeframes, near significant CME levels or during RTH gap formations can assist traders in anticipating potential reversals and adjusting their directional bias accordingly.
- For a swing low: the middle candle’s low is lower than the lows of the candles on both sides.
- For a swing high: the middle candle’s high is higher than the highs of the candles on both sides.
This is what we refer to as a three-candle pattern, which we use to identify these key highs and lows that signal a potential reversal.
One way to identify these swing highs and swing lows is by using the Fractal Indicator created by Igor, which is publicly available.
This indicator marks the chart with an arrow whenever a swing high or swing low appears. The explanation of how to use it can be found here.
Conclusion
By combining the CME RTH chart view with awareness of high-timeframe candle structures, such as the abandoned baby patterns or swing highs and swing lows, traders gain a sharper, more institutional perspective on Bitcoin’s movement.
Together, these technical details help build a clear narrative that keeps you aligned with institutional flow and ready to adjust your bias with confidence each week.