Markets don’t move in a perfectly balanced way. During impulsive phases, price can move so quickly that it leaves inefficiencies behind, areas where trading was one-sided and liquidity was thin.
In Market Profile, this inefficiency is known as a Single Print, while on a candlestick chart, it appears as a Fair Value Gap (FVG).
This article breaks down both concepts and shows how combining them can reveal high-confluence zones for precise re-entries, reversals, or continuation setups.
What Are Single Prints?
Single Prints occur when the market moves so quickly in one direction that only one TPO is recorded at that price level during a session.
These areas typically represent strong initiative activity (buyers or sellers taking control) and are often left behind during trending moves.
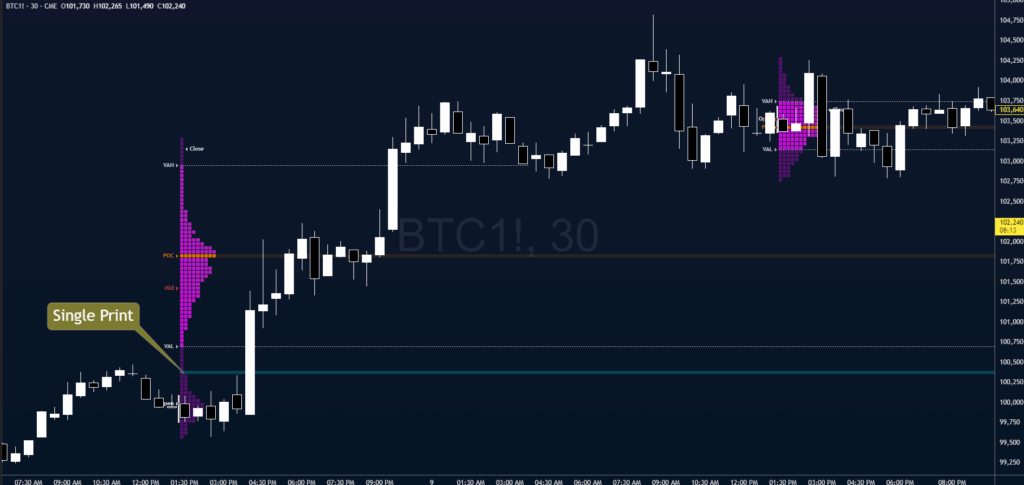
In the example below, we’re looking at an RTH Market Profile (shown in purple) on the CME Bitcoin Chart. The blue line highlights the exact location of the Single Print.
Now that we know what Single Prints represent on a Market Profile, let’s see how they form during impulsive moves.
How Single Prints Are Formed
Let’s imagine price breaks out of a range to the upside. If buyers are aggressive, the auction will move higher rapidly, and only one TPO will print at each price along the way.
This forms a column of single prints.
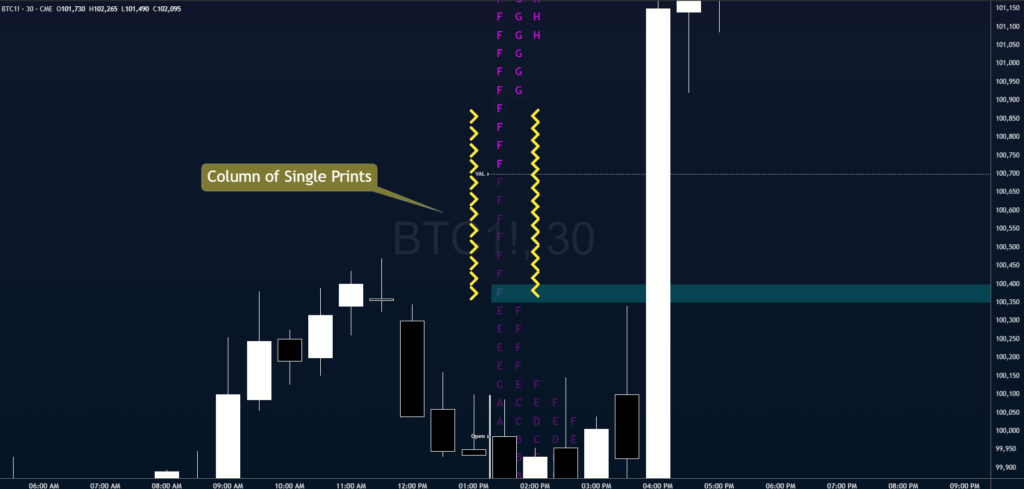
Later, when the market revisits that area, those same levels can act as support (in a bullish trend) or resistance (in a bearish one), depending on whether the breakout was to the upside or downside.
Understanding formation helps us judge why these levels matter once the price returns to them.
Why Single Prints Matter
- Show market conviction: They tell you where participants were aggressive.
- Act as magnets or barriers: Price often returns to fill these inefficiencies, but sometimes they hold perfectly as continuation zones.
- Help define context: When combined with other concepts like fair value gaps, they offer confluence for identifying strong setups.
Example: Bullish Single Prints
In the example below, the blue line marks a support Single Print.
During the RTH session, we can see how price reaches this level at 104,165 on the CME Bitcoin chart, where it acts as strong support and produces a significant bounce.
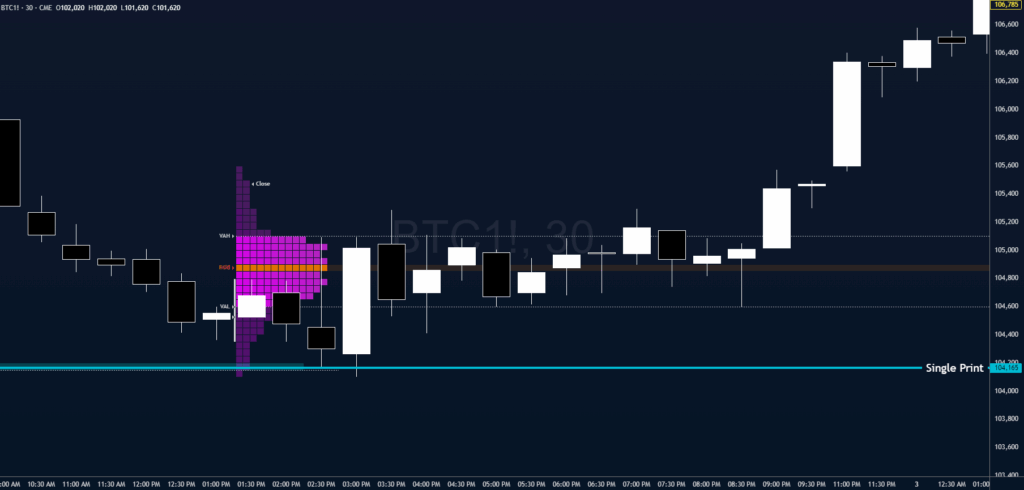
It’s important to note that in this case, we only consider Single Prints formed during the RTH session.
With the time-based view covered, we can now examine the price-based lens: Fair Value Gaps.
What Is a Fair Value Gap?
A Fair Value Gap appears when there’s a sharp move in price, leaving a “void” between the wicks of three consecutive candles.
This usually happens during moments of high volatility, when aggressive buying or selling creates an imbalance between supply and demand.
- Bullish FVG: Forms when the market moves up quickly, leaving an unfilled space between the previous candle’s high and the next candle’s low.
- Bearish FVG: Forms when price drops, leaving a gap between the previous candle’s low and the next candle’s high.
These gaps signal inefficiency, meaning the market moved too fast and may later return to “fill” that area to rebalance orders.
Next, we’ll break down the simple three-candle sequence that creates an FVG.
How Fair Value Gaps Form
A simple way to visualise it is through a three-candle sequence:
- Candle 1 sets the initial move.
- Candle 2 expands strongly in one direction, creating distance between wicks.
- Candle 3 closes without overlapping the wick of Candle 1.
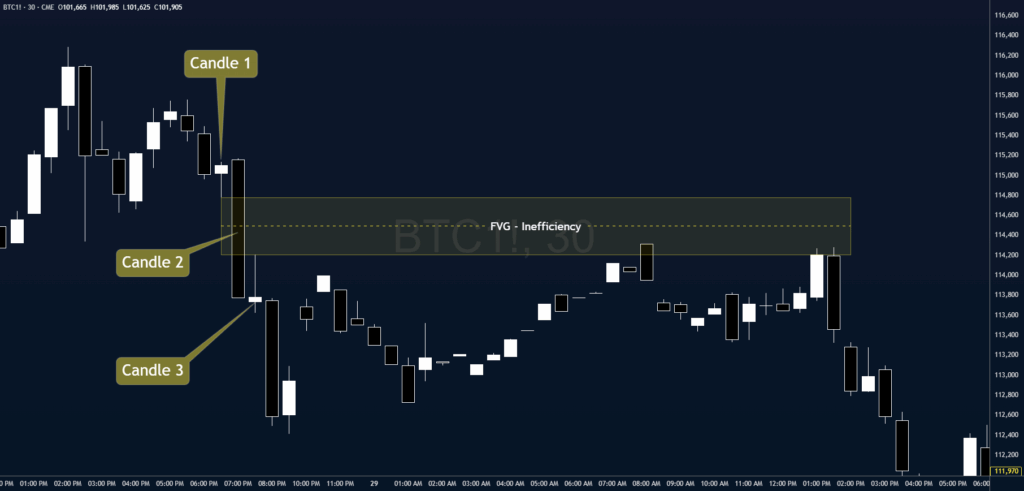
That “empty” zone becomes the Fair Value Gap, and it often acts as a magnet for price later on.
With the mechanics clear, let’s ground the idea with a bearish example.
Example: Bearish FVG
Price is trading around 115K and quickly drops to 113.7K in a single 30-minute candle.
Within this move, there’s an area where price moved too fast, between 114,775 (Candle 1 low) and 114,205 (Candle 3 high).
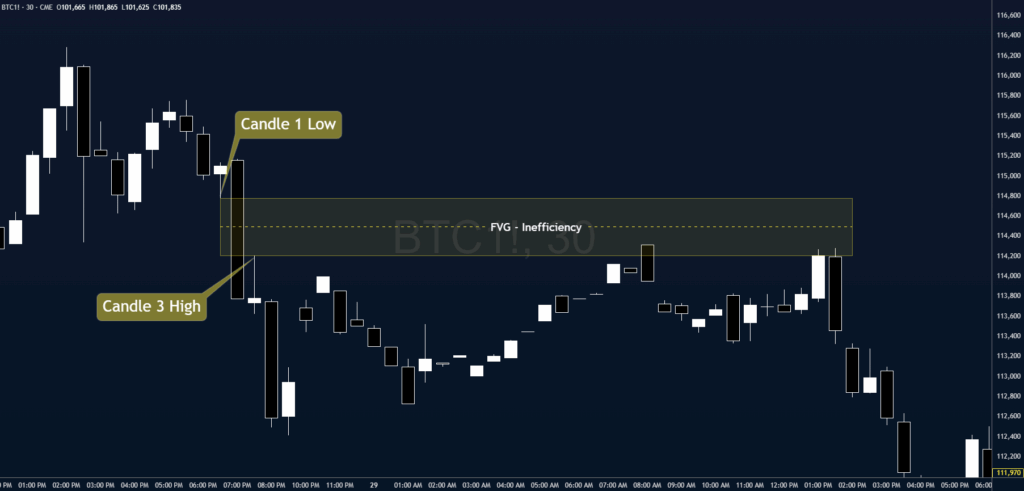
This area is known as a Fair Value Gap (FVG) and represents a pocket of inefficiency created by aggressive selling pressure.
The next day, the market retests this same zone, which now acts as a supply area, where sellers step back in.
Finally, we’ll bring both worlds together to identify high-confluence zones.
When Single Prints and Fair Value Gaps Combine
When a Single Print and a Fair Value Gap appear at the same price zone, they mark the same phenomenon: a strong one-sided move, leaving behind an inefficiency.
The Single Print reflects this imbalance through time (only one TPO traded), while the Fair Value Gap shows it through price (a void between candles).
When they overlap, the zone becomes a high-confluence area where price often reacts, either rejecting or rebalancing.
In the example below, both concepts combine. They appear below the Point of Control (POC) and the anchored VWAP, which reinforces the bearish bias and increases the probability of seeing lower prices after the FVG + SP zone is retested as resistance.
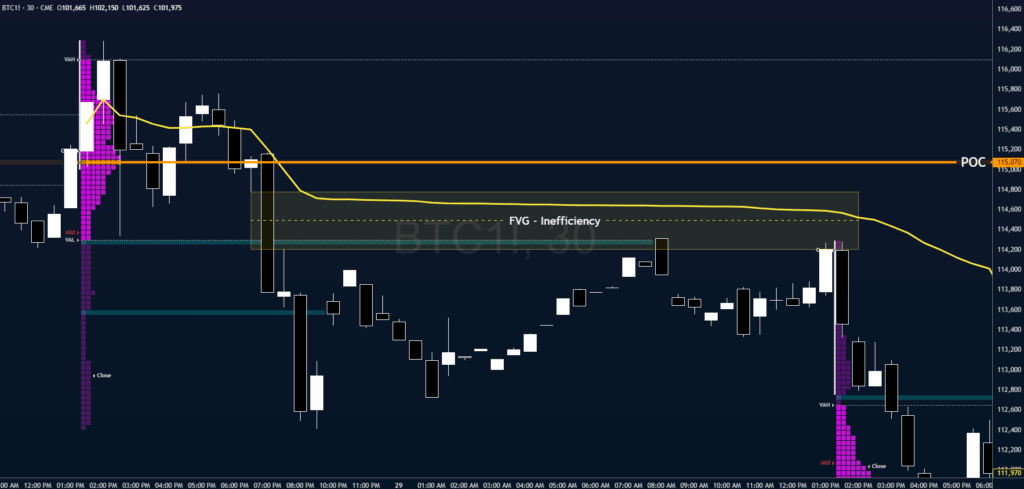
Using this information to strengthen the context of our setups is extremely valuable, as it helps improve the overall probability and precision of our trades.
Download the Single Prints & Fair Value Gaps Cheat Sheet
Want a quick visual guide to everything we covered here?
Download our Single Prints & Fair Value Gaps Cheat Sheet (PDF) showing how to identify these imbalances, mark them on your charts, and trade them with confidence.
Not working? No worries, enter here to receive and download.
Keep it handy while you trade.
Conclusion
Single Prints and Fair Value Gaps highlight the same thing: moments of imbalance where price moved too quickly.
When they align, they reveal powerful zones where the market is likely to react or rebalance, turning volatility into opportunity.
At Chart Champions, we offer courses that teach you exactly how to apply these concepts in your own trading, and through our live trading streams, you can watch our coaches use these strategies in real time.