At Chart Champions, we use Fibonacci to trade all-time highs and all-time lows across any asset, whether it’s stocks or cryptocurrencies. The Fibonacci retracement is a versatile tool that also allows us to project potential support or resistance levels, even in uncharted price territory.
In this article, we’ll show you how to use Fibonacci to set targets in your technical analysis using a different setup that helps you project price in price discovery scenarios—those moments where it’s especially tough to know where to take profit or how far price might run.
What is the Fibonacci Expansion?
The Fibonacci Expansion is used to project future price targets beyond the current price range. It’s a special configuration of the Fibonacci retracement tool, useful when the price breaks beyond a swing high or low.
It’s widely used by Daniel, who created a dedicated lesson on how to use Fibonacci to trade all-time highs as part of our trading course.
When Should You Use Fibonacci Expansion?
You should consider using the Fibonacci Expansion tool when:
- Price breaks beyond a key pivot high or low.
- You’re looking to identify profit targets in new all-time highs or lows scenarios.
- You want additional confluence for a setup where other indicators (like RSI, divergences, or support/resistance) are already aligned.
- When doing Elliott Wave projections or working on Harmonic patterns.
Although it shouldn’t be the sole basis for entering a trade, it adds valuable confluence when combined with other tools.
Using Fibonacci To Trade All-Time Highs: Use Cases
Let’s explore how Fibonacci has been applied in real-world scenarios, such as gold, Bitcoin, and our latest high-timeframe projection for 2025.
Daniel’s Elliot Wave Analysis on Gold
One effective way to integrate Fibonacci Expansion into our analysis is through the use of Elliott Waves. In the following chart, we see a high-timeframe count on gold, where Daniel selects the Wave 3 and Wave 4 pulls to apply the Fibonacci retracement from high to low.
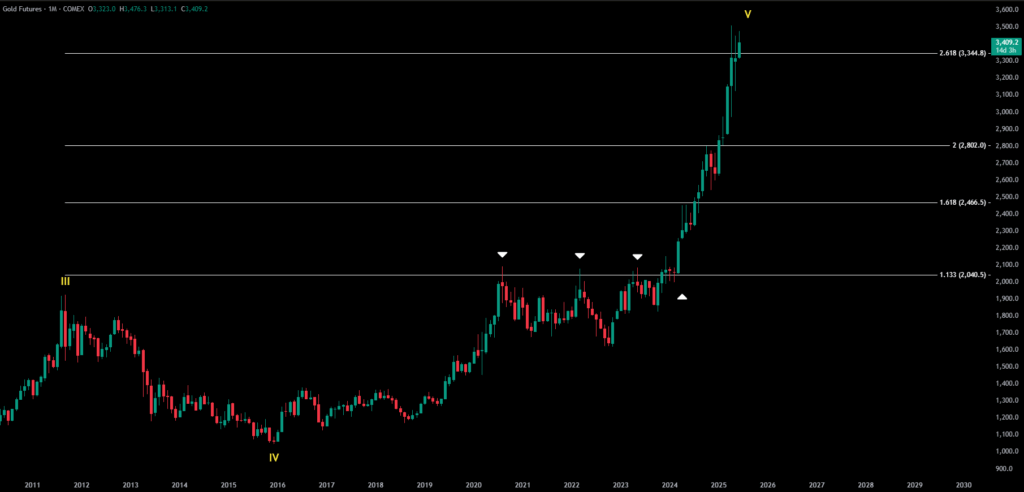
We can see that the 1.133 level acted as strong resistance for an extended period, keeping the price below $2040 for three years. It wasn’t until late 2023 that gold finally broke above this level, flipping 1.133 into support as the uptrend continued.
During this bullish impulse, the 1.618, 2.0, and 2.618 levels have triggered significant pullbacks in gold’s price.
This highlights the importance of considering these levels in high-time frame analysis.
Fibonacci Expansion and Bitcoin
The following example illustrates Bitcoin’s ascent to all-time highs in 2020. For the given range (between A and B), we can see that the price found support at the CC Fib Level, triggering a strong and sustained bullish move toward higher Fibonacci Expansion levels such as 1.618 and 2.0.
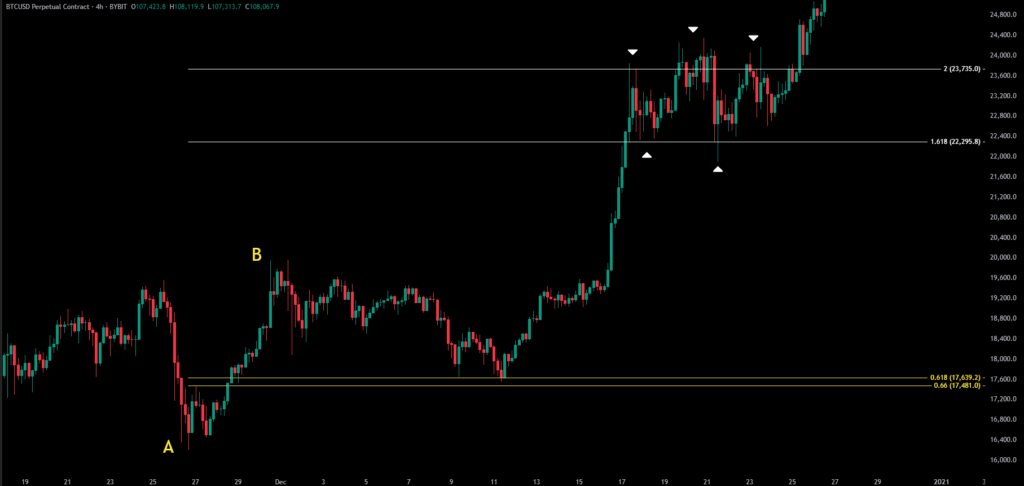
Price consolidated between these two levels before continuing the uptrend. Once again, this highlights the value of Fibonacci Expansion in identifying potential resistance levels in an all-time high scenario.
Bitcoin Elliot Wave Count Explained: 2025 Prediction
If you want to dive deeper into this analysis and understand exactly how we mapped out Bitcoin targets for 2025, don’t miss Daniel’s video breakdown.
He also walks through the Elliott Wave count that projected the $15,000 bottom years in advance.
Here are the main levels on Bitcoin to watch in 2025:
- $112,000 – A potential fakeout just above the current ATH.
- $117,000 to $121,000 – A strong confluence zone, identified using multiple Fibonacci projections, including the 1.618 expansion.
- $133,000 – A 1:1 measured move from an internal wave count.
- $130,000 to $150,000 – Final upside targets to complete the larger fifth wave before a major market correction.
This is the perfect example of how powerful Elliott Wave Theory becomes when paired with precise Fibonacci projections.
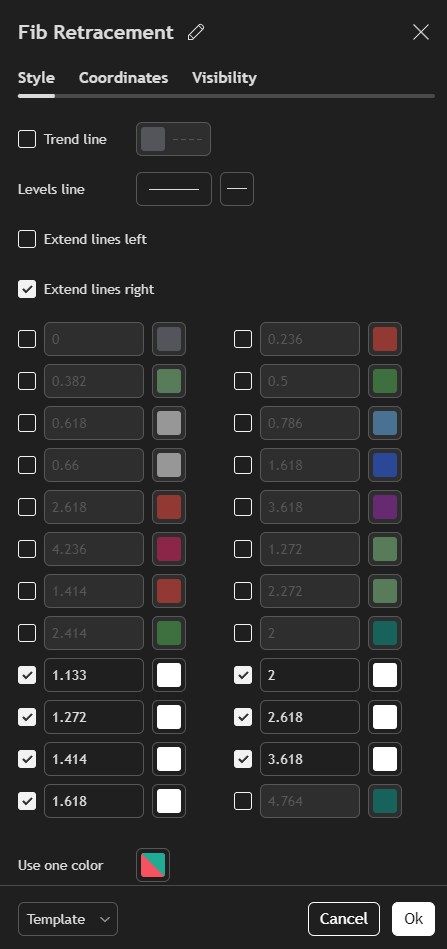
Fibonacci Expansion Settings
The Fibonacci Expansion numbers we use at Chart Champions are:
- 1.133
- 1.272
- 1.414
- 1.618
We can also add the 2.0, 2.618, 3.0, and 3.618 levels. Following this Fibonacci sequence will greatly support your price projections.
Conclusion
Fibonacci Expansion is one of the most powerful tools for navigating price discovery. Whether you’re trading Bitcoin, gold, or any other asset at all-time highs or lows, this tool helps you define key levels.
Combining it with Elliott Wave theory or harmonic patterns makes it even more effective, adding structure and clarity to moments of market uncertainty.