


The VWAP and Anchored VWAP are powerful support and resistance lines that help us understand the market’s fair value. Their importance in trading lies in their calculation using both price and volume.
At Chart Champions, we’ve always emphasised the importance of price action and volume, and it offers the best of both worlds. VWAP can be used in any market, whether stocks, futures, or cryptocurrencies. The best part is that it works for all types of traders: scalpers, day traders, swing traders, and even position traders.
In this guide, we’ll explore how to use VWAP in trading and what tools to combine it with for confluence. We’ll also share real use cases and trade examples we’ve taken at Chart Champions, all focused around one key concept: mastering VWAP and Anchored VWAP.
What is VWAP?
VWAP stands for Volume Weighted Average Price. At its core, it’s a dynamic support and resistance line that reflects the average price at which most volume has traded throughout a session or over a chosen period. This makes it a powerful reference for identifying fair value in the market.
But what type of indicator is VWAP exactly?
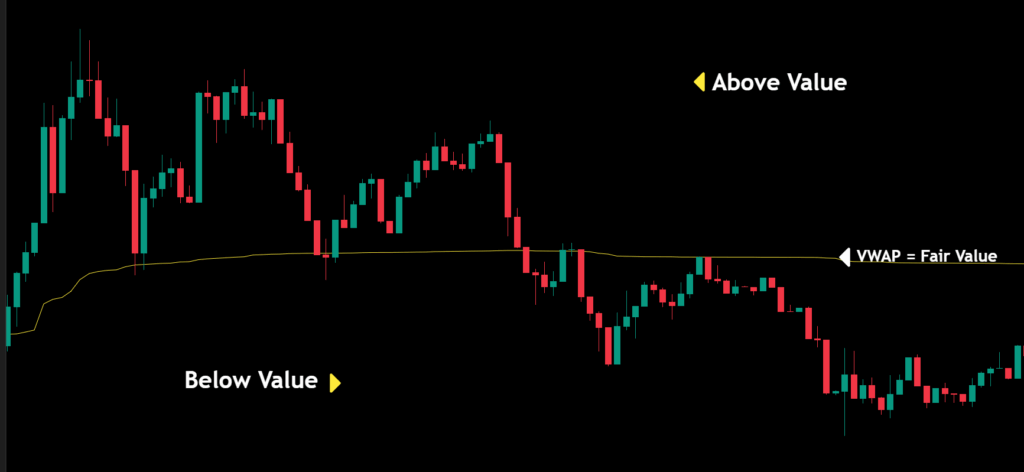
VWAP is a reactive indicator that shows us where price and volume have agreed, which means heavy market activity has taken place. We use it to understand whether the market trades above or below its value.
- When the price is above the VWAP, it’s considered above value.
- When the price is below the VWAP, it’s considered below value.
This makes VWAP a favourite among traders who work with large position sizes, such as institutional players, because VWAP tends to offer areas of low slippage and high liquidity. It’s also handy for confluence, especially when it aligns with other key levels like Fibonacci retracements, point of control, or value area highs/lows.
How To Use VWAP Effectively
VWAP is a dynamic level from which price is very likely to react. Therefore, we will use it to identify high-probability setups. To maximise VWAP’s benefits, it is essential to combine it with other confluence tools and select the right timeframe based on your style.
Let’s break down how it works across different timeframes and explore how to integrate it with other tools for precision.
VWAP for Scalping and Day Trading
For scalping and intraday trading, we use the Session VWAP, which resets daily. This version is most effective on timeframes below one hour, especially:
- 1-minute to 5-minute charts for scalping
- 5-minute to 30-minute charts for day trading
Low timeframes allow you to zoom in and observe how price interacts with the VWAP line. In trending markets, the session VWAP often acts as dynamic support or resistance, perfect for quick entries and exits.
When the price is above it and finds support on the line, we look for longs; when it’s below and finds resistance below the line, we focus on shorts.
VWAP for Swing and Position Trading
For swing and position traders, the process is similar. We can still take advantage of higher timeframe VWAPs, such as the:
- Weekly VWAP → ideal for swing trades within the week
- Monthly VWAP → for broader trend context
- Yearly VWAP → used mainly by position traders looking at macro support and resistance areas.
These levels reflect longer-term fair value and can act as strong areas of support/resistance. When price revisits one of these VWAPs after a long move away, it often provokes a powerful reaction, especially on the first retest in a trending market.
But here’s the key: just because a VWAP comes from a higher timeframe doesn’t mean it’s useless for intraday trading. In fact, at Chart Champions, we actively look for confluences between higher-timeframe VWAPs and intraday levels such as:
- Previous day high/low
- Value area high/low
- Point of control (POC)
- Single prints
- Order blocks
- Fibonacci levels
When using VWAP, the market context plays a crucial role in how the price reacts to it.
- In a strong uptrend, we might expect VWAP to act as support on pullbacks.
- In a range-bound market, VWAP often sits near the middle, acting as both support and resistance.
- In a downtrend, price tends to reject VWAP on the way down.

How To Use The Anchored VWAP
Anchored VWAP (A-VWAP) is quite similar to trading with the regular session VWAP. The main difference is that with A-VWAP, you manually select a specific point on the chart from where it will begin to form.
Like the session VWAP, the anchored version works with both price action and volume, acting as a dynamic support or resistance level. The key, however, is knowing where to anchor it.
There are two common points where we typically anchor the VWAP:
- From the beginning of a trend
- From a swing low or swing high

A well-anchored VWAP gives you a clear picture of value since that moment and helps you track how the price reacts to that reference as the market develops.
- In a bullish trend, the price often drops to the anchored VWAP and bounces from it, continuing the uptrend.
- In a bearish trend, the A-VWAP often acts as resistance, rejecting the price when attempting to move higher.
A weakness signal could be when the price loses the anchored VWAP, especially if it had been held as support until then.
Trading With VWAP: Real Examples
Using the session VWAP on lower timeframes can offer a couple of solid opportunities during a trading session. It all depends on the market context and the other tools we use to find confluence on the chart.
Trade Example 1
In the following example, we’re looking at a 5-minute Bitcoin chart. Price makes a bullish push, which is a great moment to look for a retrace down to the CC Fibonacci level. Once we activate the session VWAP, we can see that both levels align in the same area.
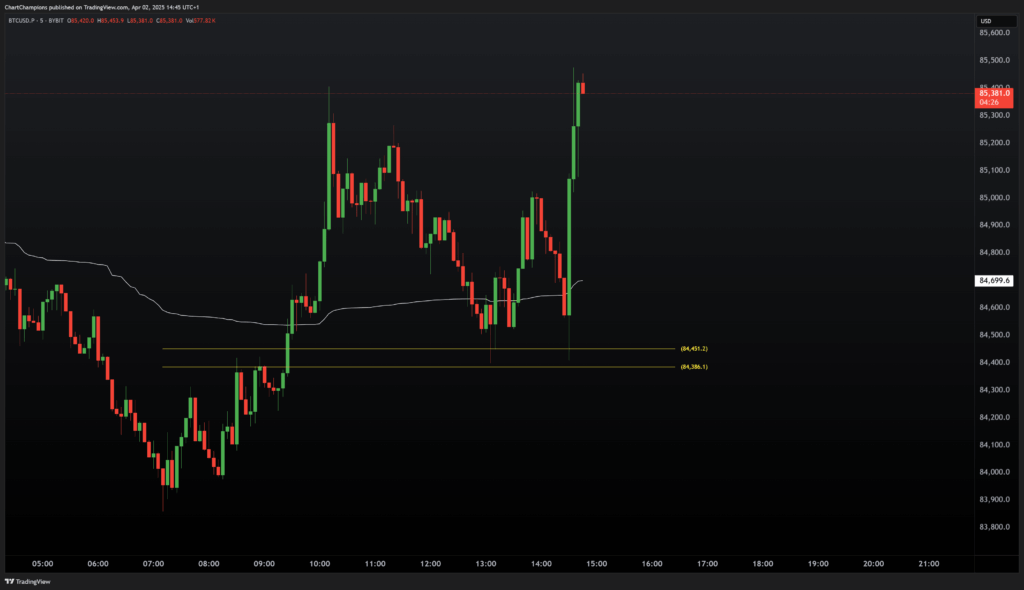
As the New York session opens, fresh volume enters the market, pushing price straight into our support zone, where we have the ideal confluence: session VWAP + Fibonacci.
Trade Example 2
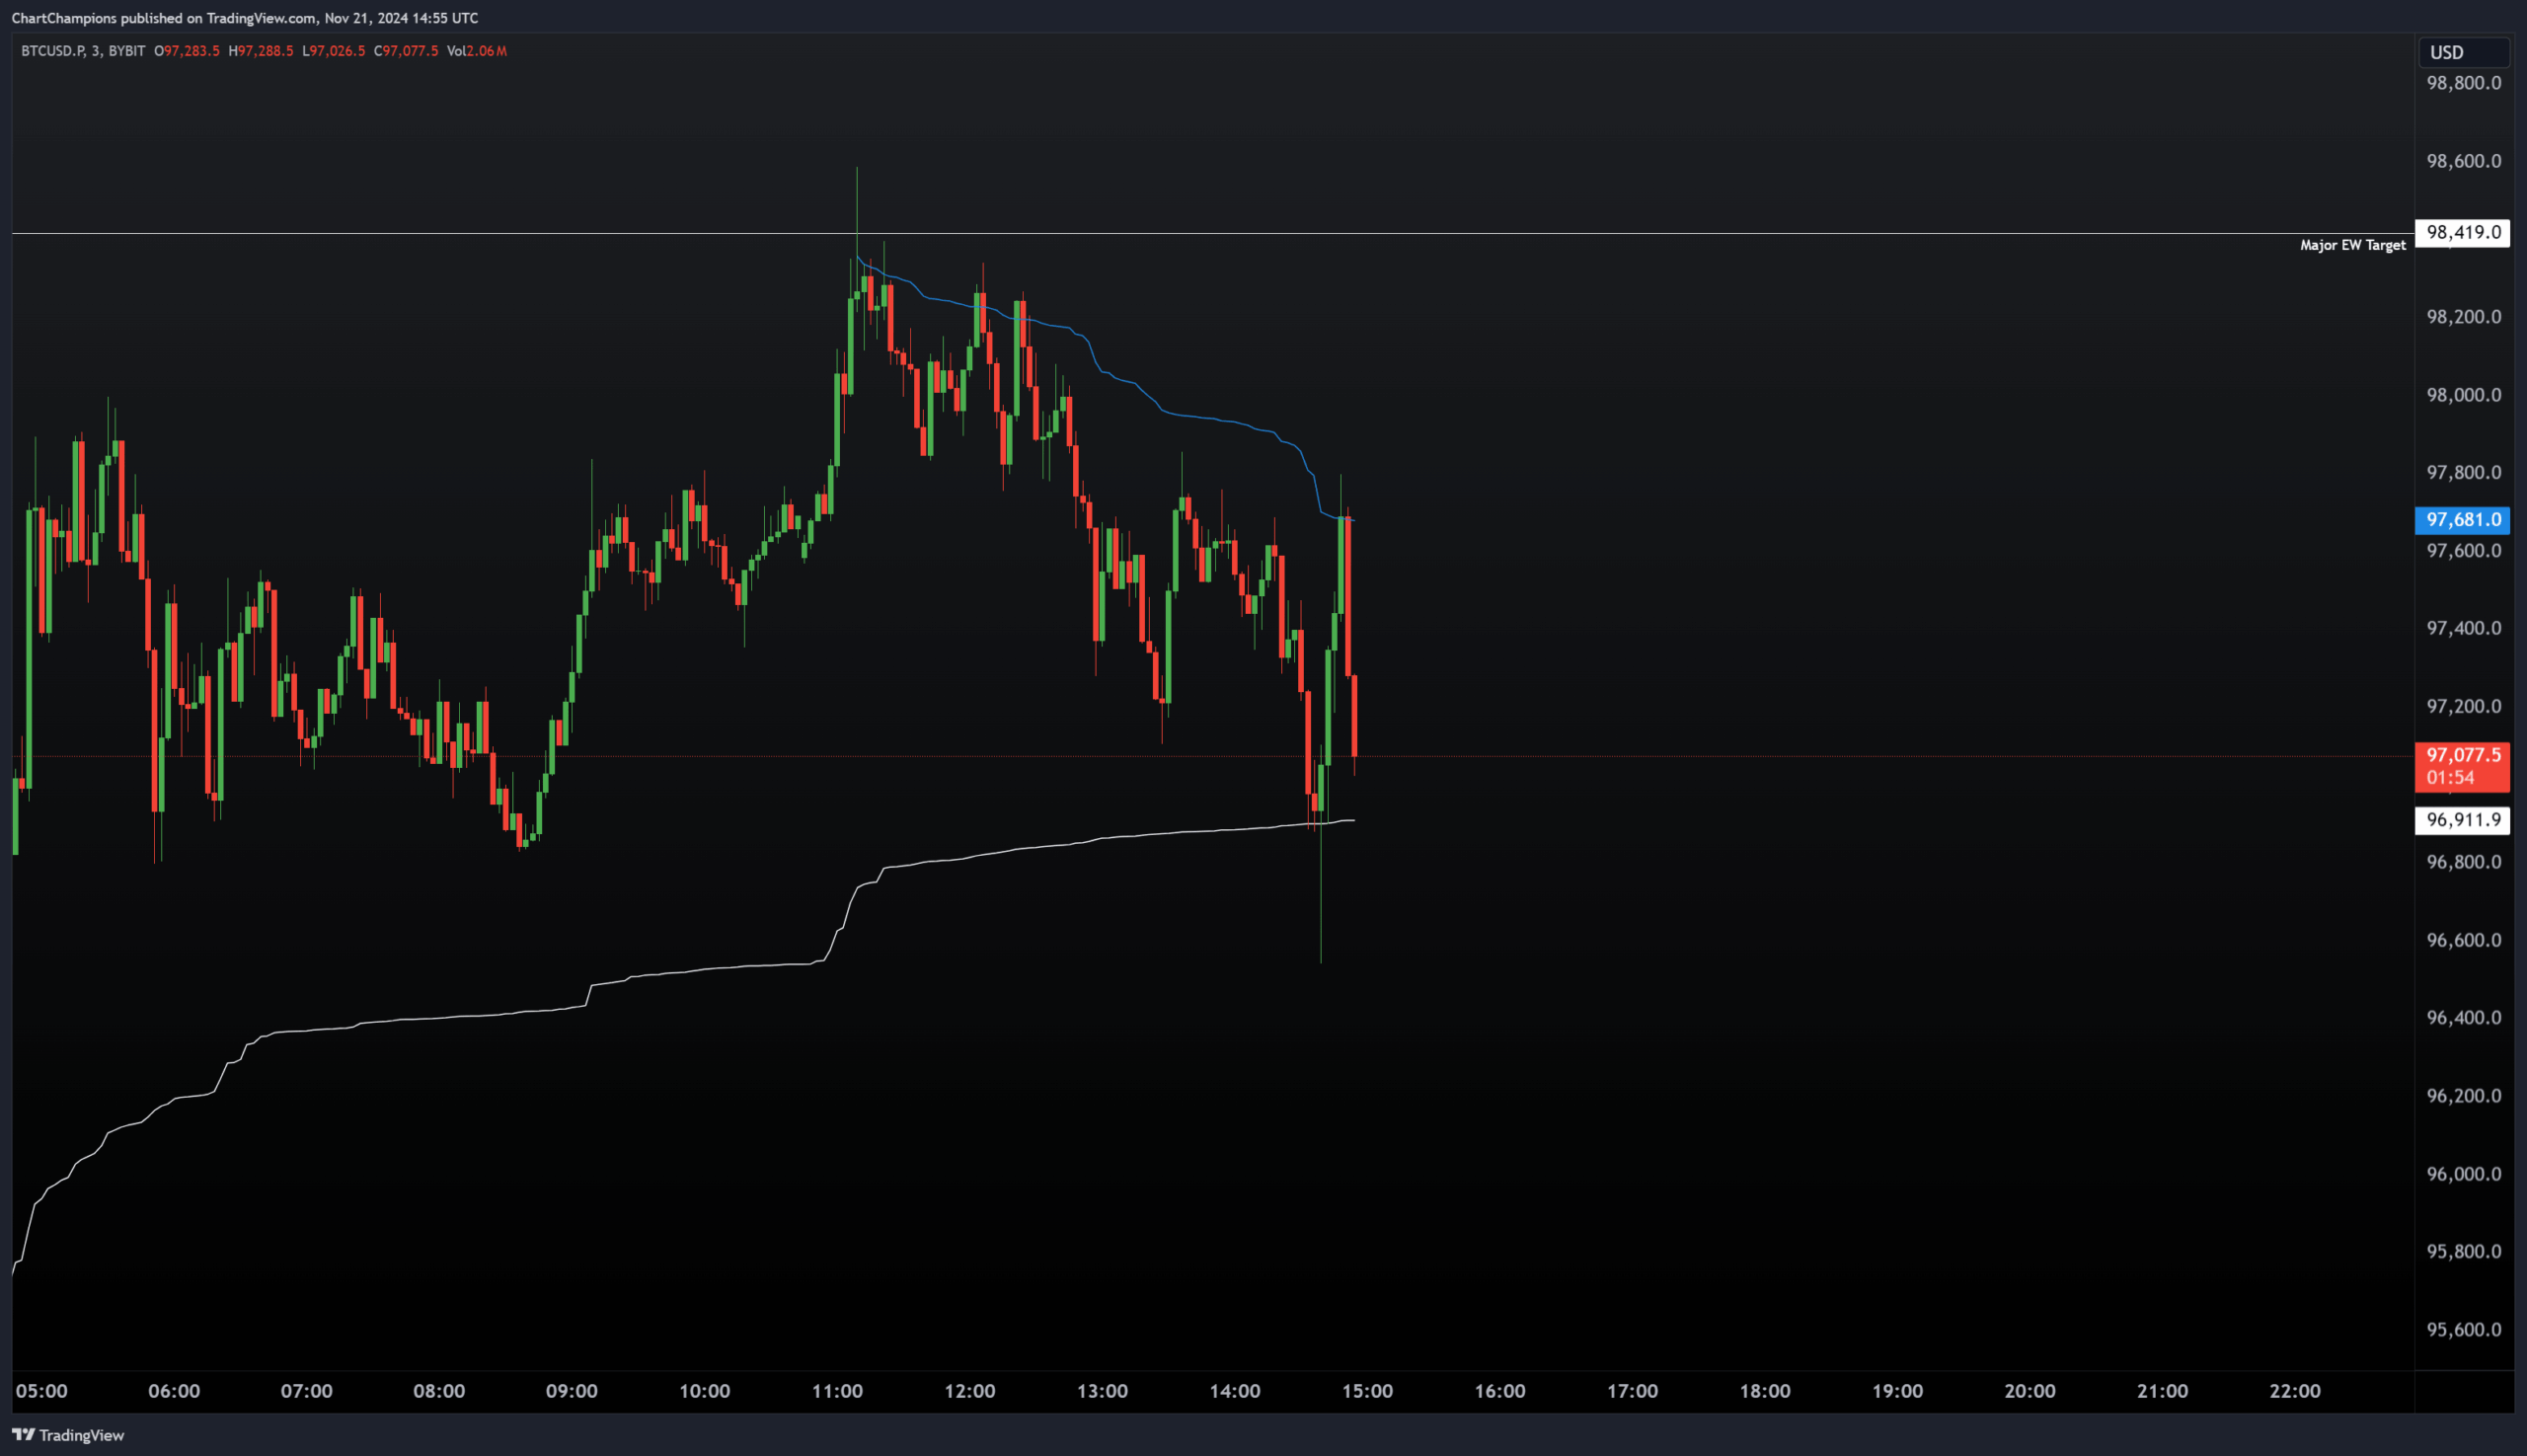
The next example clearly reminds us that using technical tools is a must in the markets, even during high volatility.
Here, we see a trade in which the price moves from the session VWAP (support) all the way up to the Anchored VWAP (resistance) on a 3-minute Bitcoin chart.
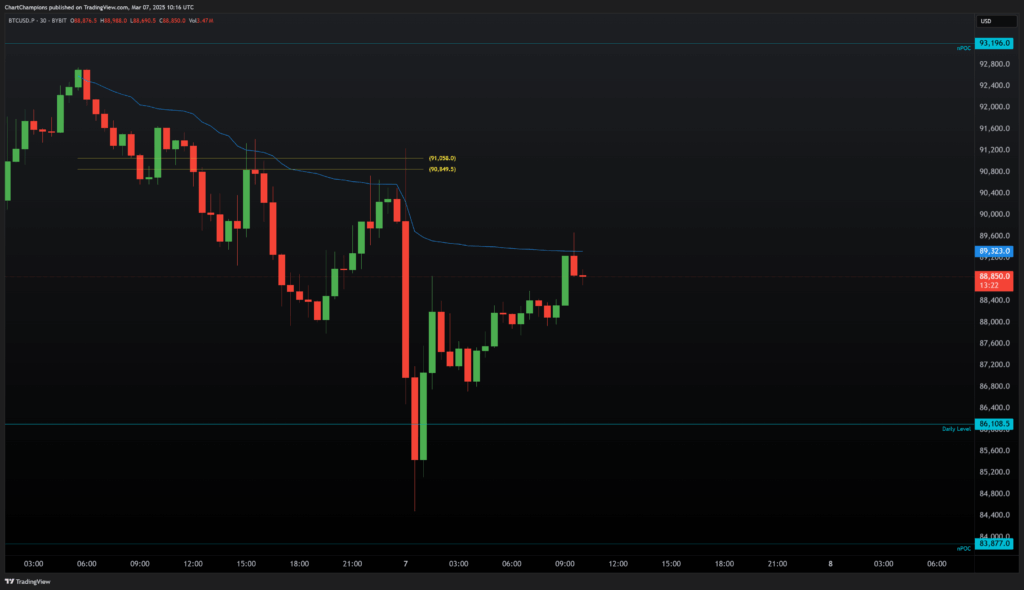
Trade Example 3
Anchored VWAP can also be used to find very strong support or resistance levels, especially in downtrending markets. In this case, we can observe how the Anchored VWAP acts as resistance throughout the entire bearish move.
VWAP Settings
We use the standard VWAP, which is calculated using the formula (source): (H + L + C) / 3.
If you’re using VWAP for scalp or day trading, the Anchor Period should be set to Session, which corresponds to the current trading session and resets the next day.
VWAP bands are additional lines placed at a set standard deviation above and below the VWAP. They work similarly to Bollinger Bands and can help visualise potential overextended moves or volatility zones.
However, at Chart Champions, we only use the main VWAP line, which consistently gives us the best results. For this reason, we turn the VWAP bands off.
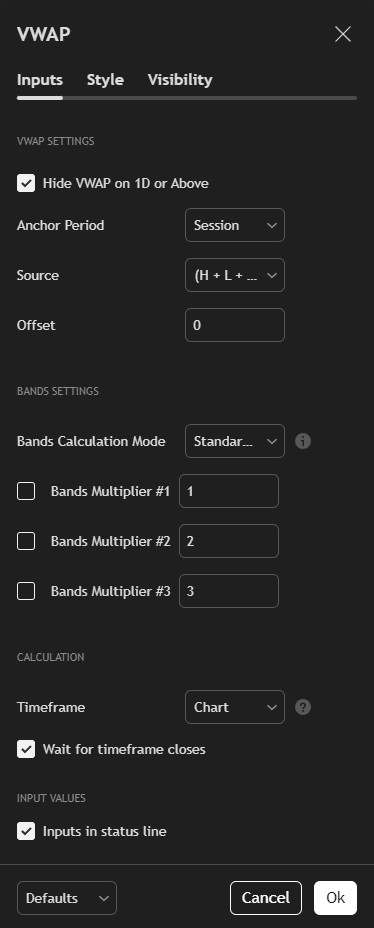
Pro tip: To view the Weekly, Monthly, or Yearly VWAP, select the corresponding timeframe in the Anchor Period section.
Conclusion
VWAP and Anchored VWAP are two of the most effective tools traders can use to identify fair value and spot high-probability trade setups. While VWAP gives us a dynamic view of value throughout a session or fixed period, Anchored VWAP adds precision by letting us track price and volume from key market points.
By combining VWAP and Anchored VWAP with other technical tools and understanding the broader market context, traders can gain clearer entries, stronger confluence, and better structure in their strategies—whether on the one-minute chart or across macro timeframes.


Leave a Reply