


Triangle patterns are among the most common trading patterns we will see as traders. They typically appear during consolidation phases and are primarily continuation patterns; therefore, we must identify the main trend that precedes their formation.
Since the market ranges about 80% of the time, spotting triangle patterns becomes pretty straightforward, and we will bump into them plenty of times throughout our trading journey.
In this article, we’ll discuss the different types of triangles and how to trade them cleanly and simply, helping us make fast and confident decisions. Volume will be a big piece of the puzzle here, so let’s grab a pen and paper and dive in!
What is a Triangle Pattern in Trading?
A triangle is a chart pattern we see during ranging or consolidation phases and is known as a continuation pattern. Identifying the main trend will help us to assess the probability of the upcoming breakout. One of its key characteristics is decreasing volume as it develops.
In trading, we find three main types of triangle patterns:
- Ascending Triangle
- Descending Triangle
- Symmetrical Triangle
They share a common trait: the price range becomes narrower over time. When we draw trendlines across the highs and lows, they converge toward an apex. Think of it like a pressure cooker; prices compress, and when they break out, we often see a sharp move backed by increased volume.
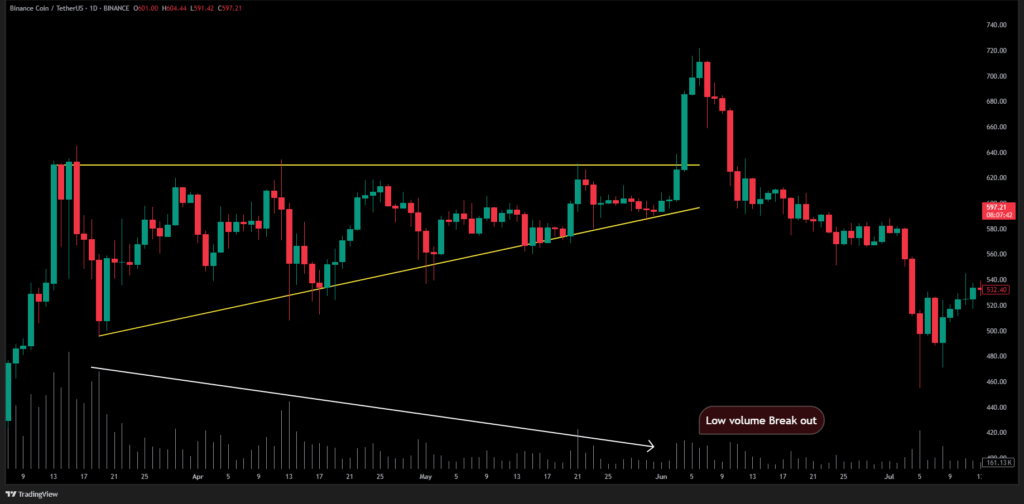
And that’s a key tip: if the breakout happens on low volume, we might be looking at a fake-out.
This is especially common in the crypto market, where fake-outs happen frequently. So, learning how to spot them becomes crucial for increasing the win rate when trading triangle setups. But before we explore that, let’s go over each triangle type so we can recognise them on the chart.
Ascending Triangle Pattern
The ascending triangle is considered a continuation pattern. That said, it can still be found in various market contexts. The key is recognising its shape: it features flat horizontal resistance at the top and a rising trendline at the bottom.
The price target is measured by taking the triangle’s height (from low to high) and projecting it from the breakout point.
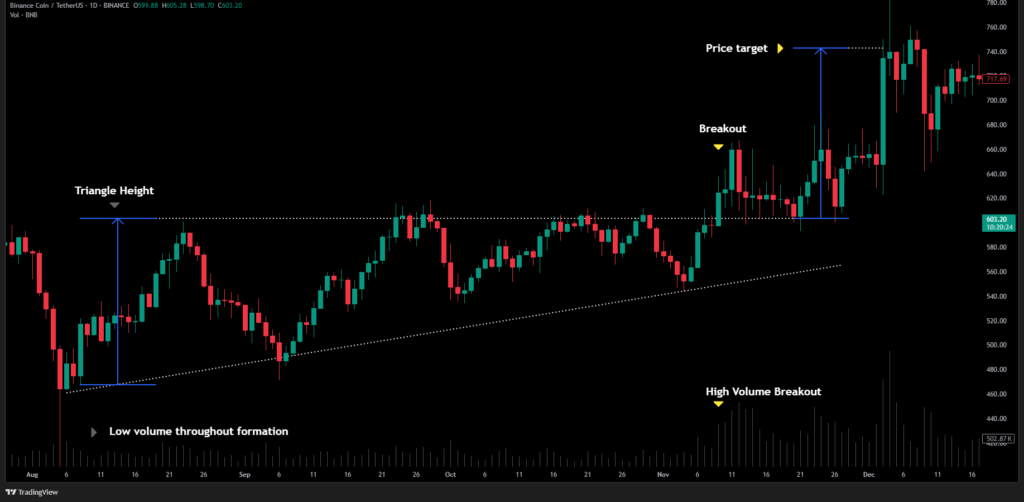
Volume tends to decrease during formation and increase at the breakout. A confirmed breakout is usually your signal to enter the trade.
Pro Tip: Always consider the market context. If an ascending triangle forms right at a higher timeframe resistance, think twice before going long on the breakout. In this case, we might be looking at a fake-out scenario.
Descending Triangle Pattern
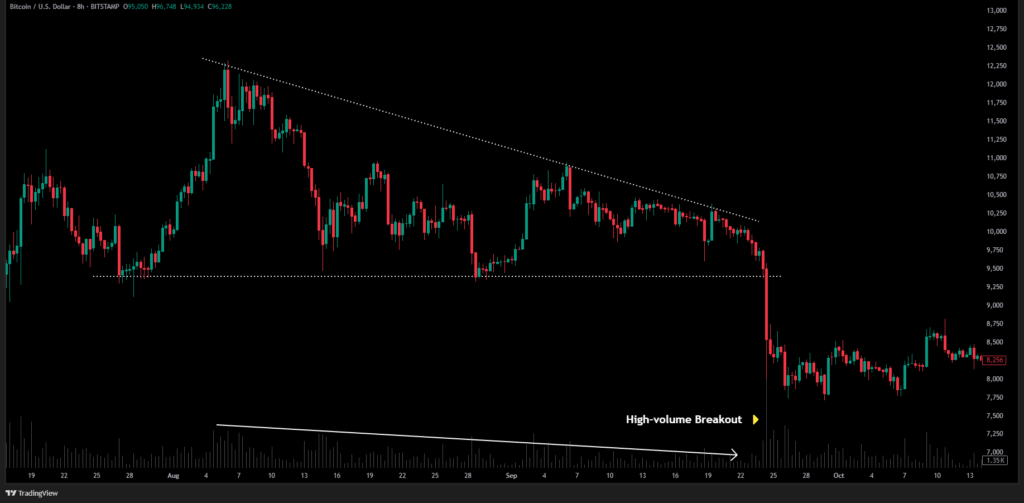
The descending triangle is also viewed as a continuation pattern, but context is crucial.
This formation features a flat horizontal support line at the bottom and a descending trendline above. Like the ascending triangle, we calculate the price target by measuring its height and projecting it from the breakdown point.
Pro Tip: If the pattern appears near a strong, higher-timeframe support level, be cautious about shorting the breakdown. Fake-outs are common here, too, and recognising them can save you from bad trades.
Symmetrical Triangle Pattern
This pattern features two converging trendlines: one sloping downward from the highs and the other sloping upward from the lows. This indicates that the price range is narrowing as the pattern develops.
Symmetrical triangles tend to break in the direction of the trend that led into them. So, if the price was in an uptrend, we’re likely looking at a bullish continuation.
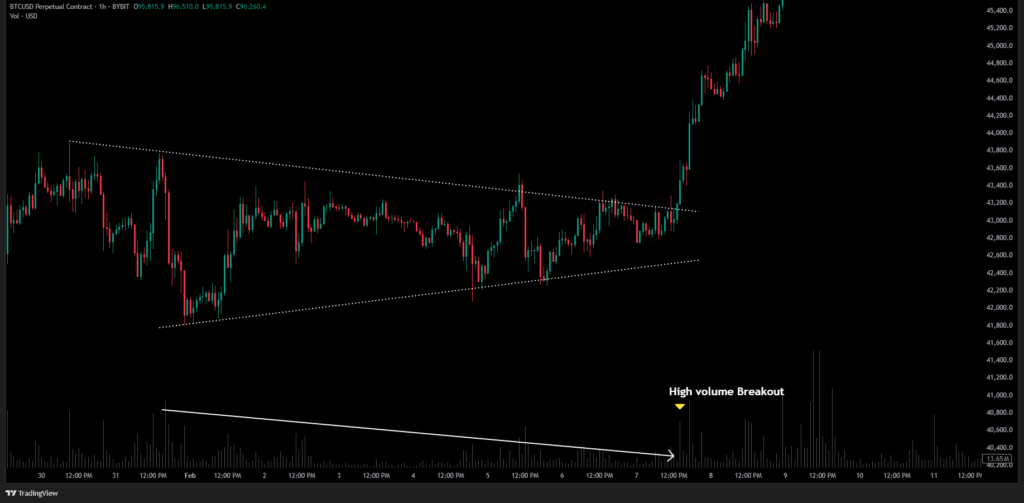
Again, measure the triangle’s height for the price target and project it from the breakout point.
Triangle Fake-outs: Key Tips
One of the most important things we’ve learned at Chart Champions is not to take every triangle breakout at face value, especially in crypto and altcoins, where fake-outs are very common.
Fake-outs typically happen when a triangle forms near a significant support or resistance level. Most traders will expect the triangle to act as a continuation pattern, blindly following the breakout in the direction of the trend without context.
But here’s the catch: that breakout might be a trap if we’re sitting at a major resistance or support zone. The price pushes through the triangle, giving the illusion of a strong move, only to reverse shortly after. It’s a classic fake-out.
If the breakout happens with low volume, stay cautious. Once the fake-out is confirmed, we look to trade in the opposite direction, and that’s often where the real opportunity lies.
Also, when everyone sees the same pattern, it’s worth asking: will the market really reward the majority? Sometimes, the best trades come from thinking differently.
If you are trading the crypto markets, always remember this. Avoiding fake-outs—or trading them with confluence—can make a real difference in your results.
Triangle Patterns and Order Flow
Adding order flow to your triangle breakout analysis can be a game-changer, especially if you aim for high probability setups.
Identifying a healthy breakout using order flow takes some experience, but we always follow a classic recipe. Our order flow guide explains how to spot bullish and bearish breakouts using order flow tools.
The goal is to keep your analysis clean and sharp. Whenever you see a triangle breakout, check the order flow: is there high volume? Do we have a positive delta (upside breakouts) or a negative delta (downside breakouts)? Are there imbalances around the breakout area?
In our footprint charts guide, we also go over strategies you can use when trading triangle setups — from spotting absorption to identifying healthy breakout conditions and more.
Conclusion
Triangle patterns are powerful tools in our arsenal, but only with context, volume analysis, and a solid plan.
Fake-outs are common, especially in crypto, so always stay alert, question obvious breakouts, and look for confluence with tools like order flow and footprint charts. The more you practise recognising these patterns in real time, the more confident and precise your entries will become.
At Chart Champions, we cover triangle patterns in detail, including how to identify, trade, and avoid common traps. In our course, we walk you through real examples and practical strategies.
See you inside!


Leave a Reply