


Choosing the right price chart is crucial for your trading success. Charts are essential tools for traders and provide great insights into market movements. We can select many different chart types; at Chart Champions, we like to use line charts, candlestick charts, and bar charts, as we found these provide good insights into price actions depending on the context.
As traders, reaching conclusions quickly in order to make informed decisions is very important. Learning to use different types of charts, which represent time movements over price, will benefit us greatly in this regard. This article will discuss these price charts so you can choose the best one for your style.
Breakdown of Price Charts
A price chart displays essential data such as the opening, high, low, and closing prices over a certain amount of time. This information helps us evaluate the price action on our preferred asset.
Line Charts: Simple and Clear
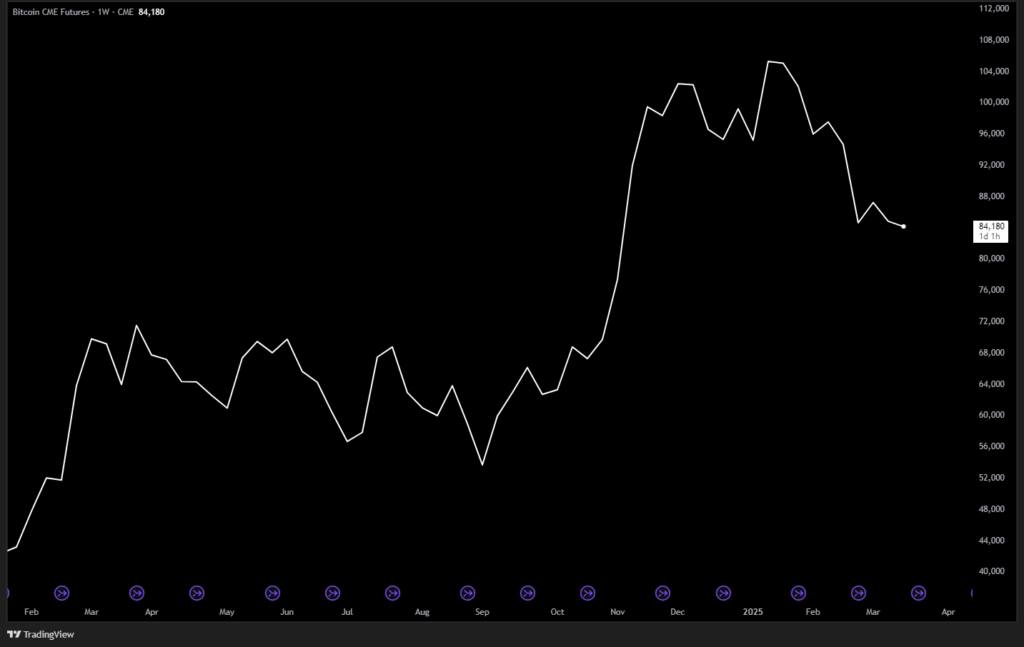
Line charts are the most basic type of price chart. They show only the closing prices of an asset over a set period. This chart type is perfect for traders who want to see an overall trend without getting bogged down in the details.
We often use line charts focusing on long-term trends and, of course, when preferring simplicity.
Candlestick Charts: Rich in Detail
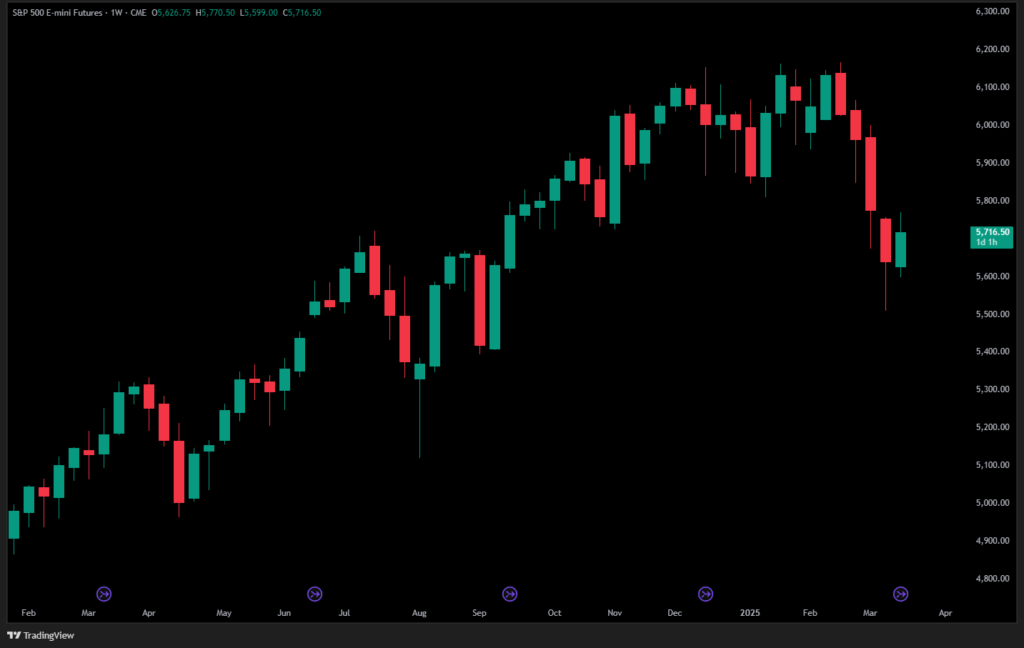
Candlestick charts are the most popular chart type among traders, from short-term to long-term timeframes.
Each candlestick provides detailed information: the opening, high, low, and closing prices for a specific period. The green colour of the candle indicates a bullish movement, while the red colour candles show a bearish movement.
They can help us to make quick decisions, especially for scalp traders or those who prefer lower term timeframes.
Bar Charts: Balanced Information
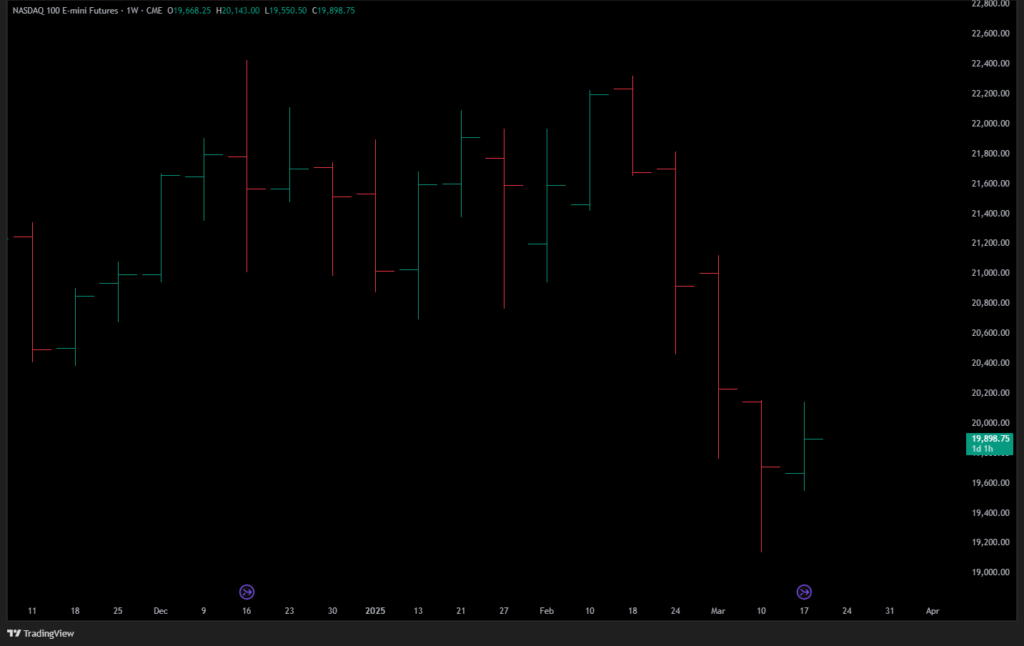
Bar charts offer a middle ground between line charts and candlestick charts. They display the opening, high, low, and closing prices in a compact format.
Bar charts are helpful if we want a clear representation of price ranges but also find candlesticks too visually complex. While less intuitive than candlesticks, bar charts still provide essential market data.
Choosing The Right Price Chart For Your Trading Style
Before selecting the best chart type, you should have adopted a trading strategy. This way, the price chart will align well with your analysis and execution.
Due to its detailed price action, the candlestick chart is the best chart type for scalp traders. At a glance, we can see whether the sentiment for that candle is bullish or bearish. By incorporating other metrics like Delta and Open interest, we can increase our understanding of what’s happening in the markets at a specific moment.
Candlestick charts are also crucial when marking the support and resistance, including similar strategies like supply and demand.
Line charts are the best for day trading, as they benefit traders seeking a broader market view. At Chart Champions, we generally look at the line chart when we want a nice market overview on the higher-term time frames. A line chart helps us reduce the noise of short-term movements.
Bar charts, on the other hand, are great for traders seeking a concise yet detailed view of price movements. They allow for the analysis of price data without the need to maintain a bias.
Both line and bar charts are great for day trading. However, they might lack detailed information. So, if you are an active trader looking for the best opportunities in the market each day, try the candlestick charts.
Remember, the best choice depends on the trading strategy selected.
Conclusion
While each chart type serves a specific purpose, there’s no rule against using multiple types in your analysis. For instance, a line chart can be used to track an overall market trend and a candlestick chart to spot short-term patterns.
Improve your trading by incorporating different price charts into your analysis so you can make quick, informed decisions and refine your strategy. Whether you prefer the simplicity of line charts on higher timeframes, the detailed analysis of candlestick charts for scalp traders, or the balanced view of bar charts, each offers unique advantages.
Choose wisely!


Leave a Reply