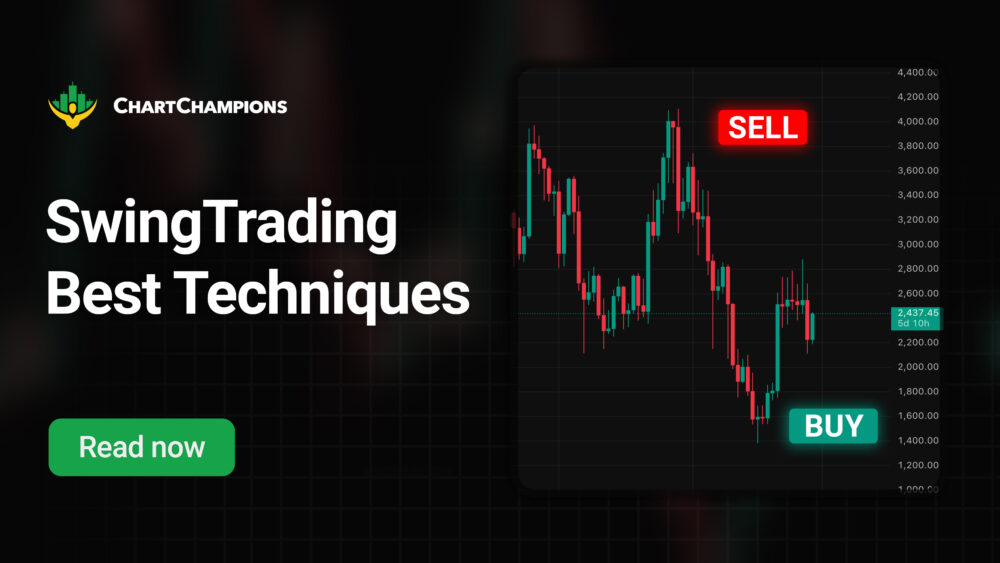
Swing trading is the easiest way to trade. Analysing the market from higher timeframes brings clarity and peace of mind, giving you time to focus on other areas of life. It’s especially ideal for part-time traders—those with families, full-time jobs, or anyone looking for a less time-intensive approach to trading.
In this guide, we’ll explore the top swing trading techniques for beginners, including practical entry strategies that work even if you have limited screen time.
What Is Swing Trading?
Swing trading allows traders to hold positions for a few days or even weeks, which is significantly longer than the typical day trading timeframe.
The preferred timeframe is the 4-hour chart, but daily, weekly, and even monthly timeframes also play a significant role in technical analysis.
At Chart Champions, we use a variety of proven strategies and tools to support swing trading. Here are some of the key tools we rely on:
- Horizontal levels (Support and Resistance)
- Naked Points of Control (via Volume Profiles or Fixed Range Profiles)
- Liquidity levels
- Anchored VWAPs
And our most effective entry strategies for swing trading include:
- Swing Failure Pattern (SFP)
- Failed Auction (FA)
- The 4 EMA Strategy
Keep in mind that every trading strategy requires an initial learning curve. But once you’re in the zone and understand how to work with these tools, preparing high-timeframe analysis becomes second nature.
The 4 EMA Strategy for Swing Trading
This is a simple yet powerful strategy that works well on higher timeframes, specifically the 4H and daily charts.
Here are the key EMAs and their colours:
- EMA 26 = Orange
- EMA 55 = Yellow
- EMA 100 = Dark Blue
- EMA 200 = Green
We use these EMAs to understand the market context. When EMAs cross, they can provide reliable signals for buying or selling.
For example:
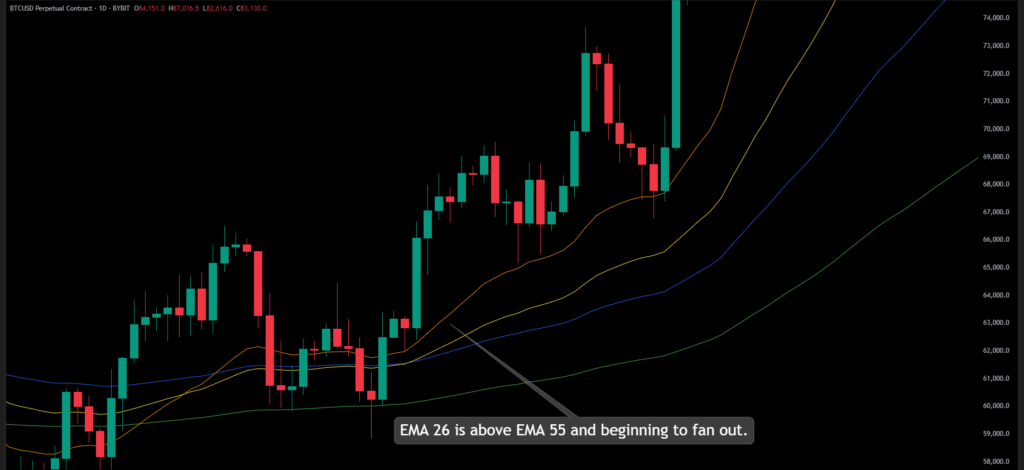
- On the daily chart, if the 26 EMA crosses above the 55 EMA and begins to fan out (with space between the lines), it indicates a strong bullish context.
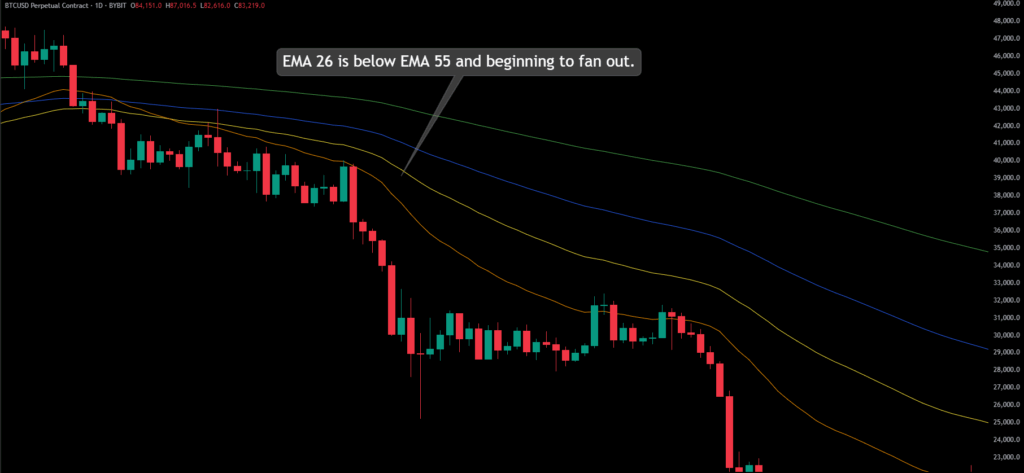
- If the 26 EMA crosses below the 55 EMA and fans out, that’s a bearish signal.
Both the EMA 100 and EMA 200 also play a crucial role. They often act as support during uptrends and resistance during downtrends.
These EMAs are especially useful when analysing Bitcoin futures (CME chart), which is widely followed by institutional traders and often sets the tone for the broader market.
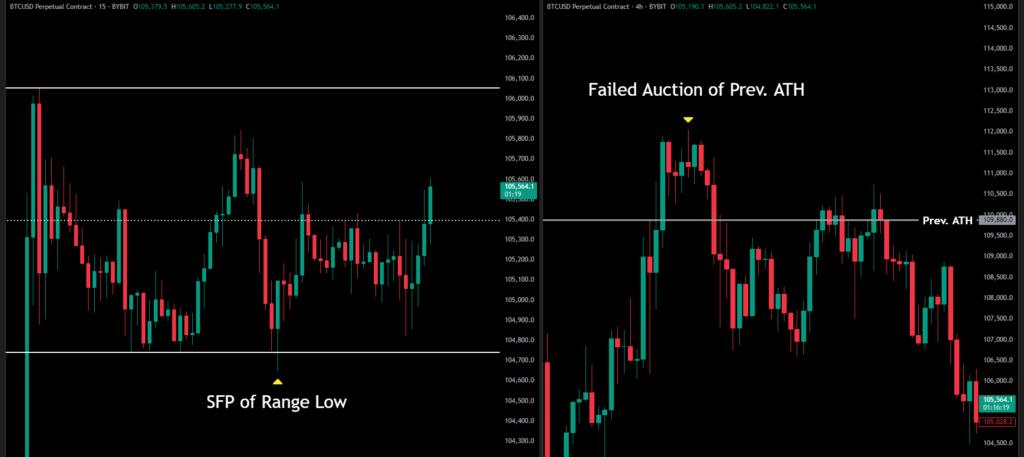
SFP vs. Failed Auction – What’s the Difference?
Understanding the difference between a Swing Failure Pattern (SFP) and a Failed Auction (FA) is crucial for swing traders.
Both setups are designed to identify likely trend reversals at key levels. In both cases, you want to see the price re-enter and gain acceptance back into the previous range.
The difference between an SFP and a Failed Auction is as follows:
- An SFP is quick. You’ll usually see a sharp wick above or below a liquidity point.
- A Failed Auction tends to linger. Price might spend several hours—or even longer—above or below the level before finally closing back inside the range.
A good signal for acceptance is a 30-minute candle close back inside the range. Of course, every context is different, but as a general rule, the more time the price spends inside a range, the more acceptance it gains.
How to Execute a Swing Trade
Once your technical analysis is complete, it’s time to enter the trade. At Chart Champions, we typically use the 30-minute chart to fine-tune entries.
Stop Loss Placement
- If you’re shorting: place the stop above the most recent wick.
- If you’re going long: place the stop below the most recent wick.
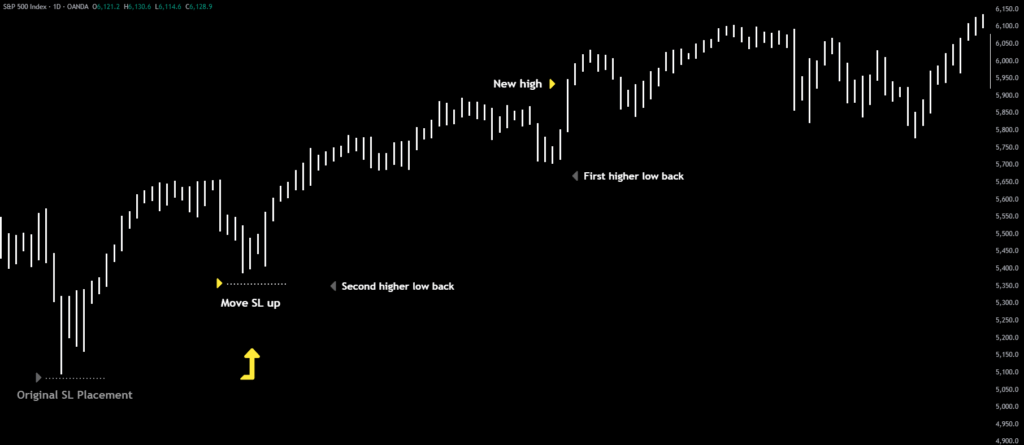
As the trend moves in your favour, you can use a trailing stop-loss, placing it 2–3 lows back to allow for normal pullbacks.
Take Profit Strategy
Since swing trading is based on higher timeframes, such as the 4H chart, we utilise horizontal support and resistance levels to take profits.
We also rely on tools like TradingView’s Fixed Range Volume Profile (FRVP), which highlights:
- VAH (Value Area High)
- POC (Point of Control)
- VAL (Value Area Low)
We usually aim to take profit at the POC, as it’s a highly reactive level.
Liquidity pools are another key area for profit-taking. Look for clusters of equal highs or lows—these are areas where reversals often happen.
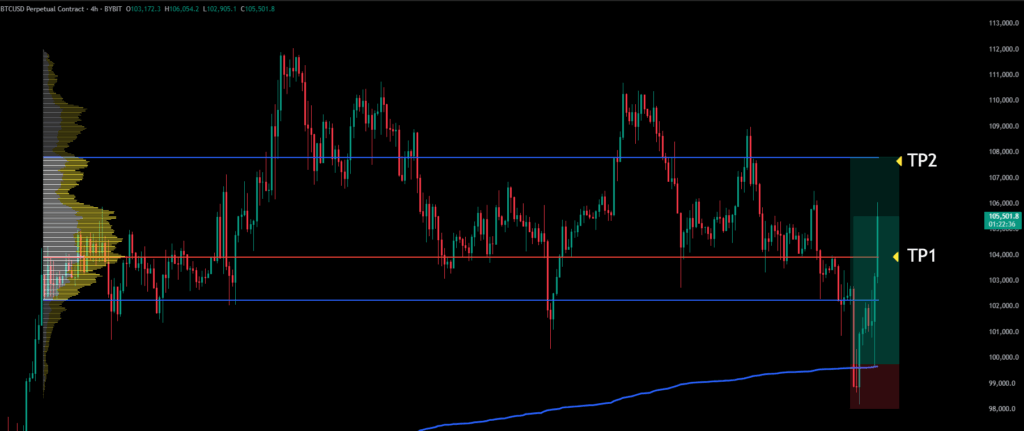
Chart Champions Swing Long Setup Explained
Here’s a swing long setup we shared publicly at Chart Champions, explained by Severin.
After Bitcoin reached a major anchored VWAP support on the higher timeframe, a bullish trend began to form. This was our signal to start looking for long entries or spot buys.
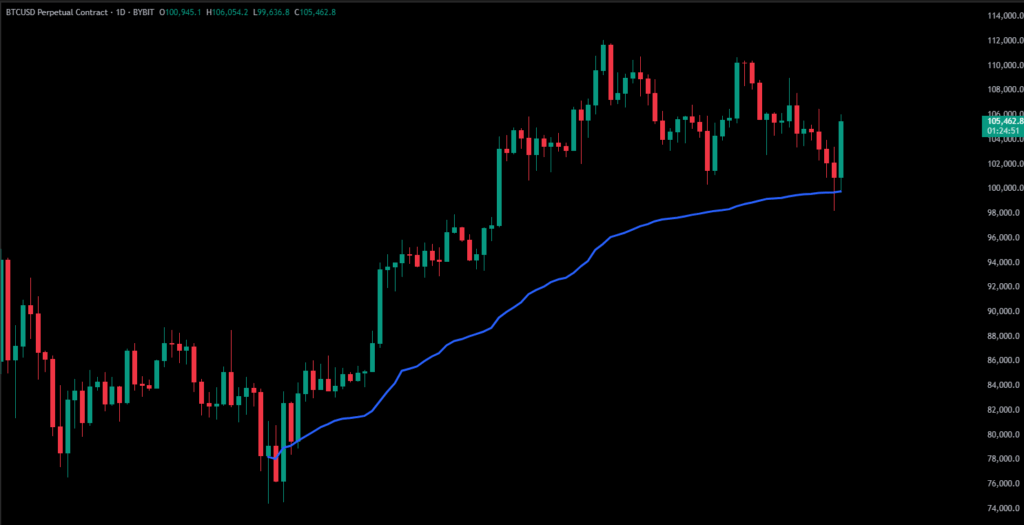
We waited for a clear change of structure on the 30-minute chart, which occurred around the $100,000 mark.
How much to take in profit?
That depends on your personal plan, but as a guideline:
- TP1 – take around 25% of the position
- TP2 – another 25–50%, depending on the market context
For TP1, we often use the POC of the FRVP.
For TP2, we aim for the VAH of the range.
When it comes to taking profit, there’s no one-size-fits-all rule; it always depends on the context and the tools you’re using. Horizontal support and resistance levels, Points of Control, and liquidity zones can all be valid areas to lock in profits.
The key is to align your targets with the structure of the chart and let the market show you where reactions are likely.
Conclusion
Swing trading is a powerful approach for traders who want to stay active in the market without being glued to the screen all day. By focusing on higher timeframes and utilising proven tools and strategies, you can develop a clear and structured strategy that suits your lifestyle.
It all comes down to planning and execution. Take your time, stick to your system, and let the charts come to you. And of course, learn swing trading techniques with the best coaches at Chart Champions!