It’s important to understand technical analysis before diving into support and resistance. Technical analysis involves two main elements: historical data and price charts. It allows us to use past information to anticipate future price movements.
In technical analysis, many tools help identify support and resistance levels, from advanced indicators like volume profiles to simpler ones like moving averages and Fibonacci retracements. Price charts themselves also help us visually identify support and resistance.
At Chart Champions, we focus on the power of support and resistance levels derived directly from price action, and today, we’ll explore this topic.
Understanding Support and Resistance
These two concepts are fundamental in technical analysis. Analysing historical movements in assets allows us to locate important reference points: Support and Resistance (S/R).
What is Support?
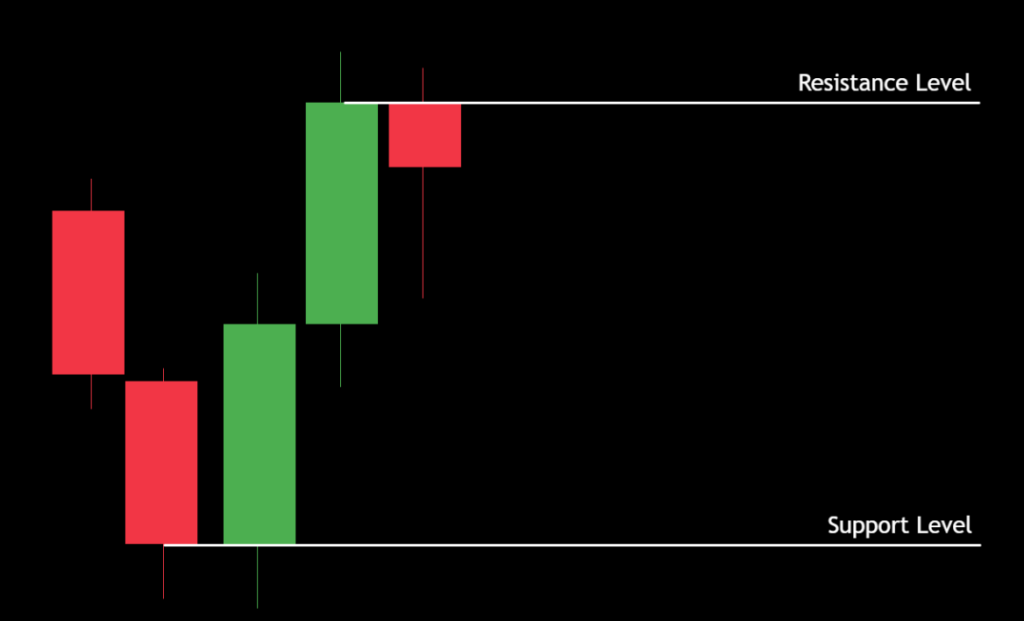
Support is a level on the chart where the price halts its downward trend due to increased demand. The buying pressure rises, preventing the price from falling further.
At this point, buyers see an opportunity to enter the market and expect the asset’s value to increase.
What is Resistance?
Resistance is a level on the chart where the price halts its upward trend due to increased supply. The selling pressure increases, pushing the price down.
Sellers view these resistance levels as a good exit or take-profit point, anticipating a bearish reversal.
How to Identify Key Support and Resistance Levels
We will use two essential concepts widely used at Chart Champions to identify key S/R levels: price action and high-timeframe levels (also known as horizontals).
Identify Support and Resistance using Price Action
Using historical price action to identify support or resistance levels on charts is simple and highly effective. To do this, we go to our preferred analysis platform, TradingView, and switch to a daily view.
We then examine the price’s highs and lows. These highs and lows are crucial because they represent turning points where supply or demand has dominated, reversing the price in the opposite direction.
We mark these high and low zones and observe how they affect the price in the future.
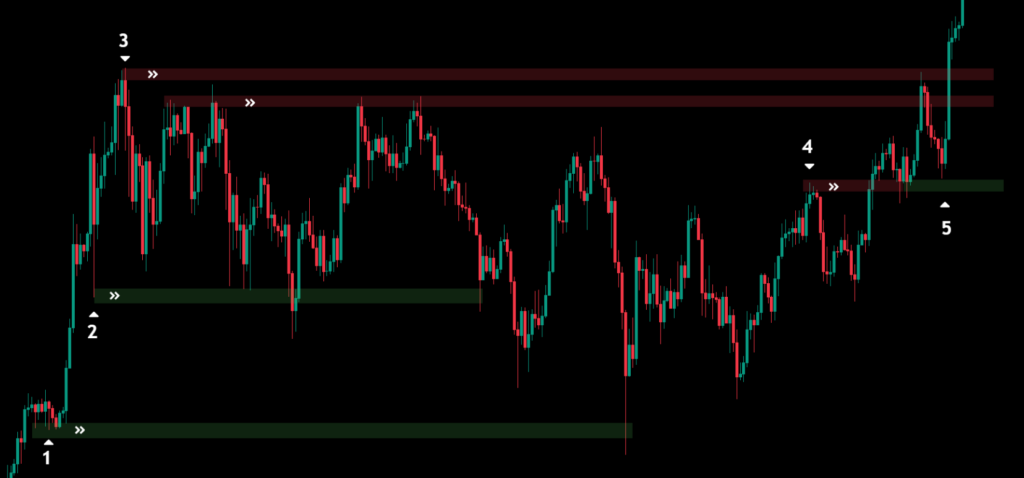
- Points 1 and 2: We focus on marking the price lows during an uptrend as potential future support zones. Once the price reaches its peak and retraces, these marked lows give us an idea of potential support areas in case the price retraces again.
- Point 3: Here, we mark the highest point reached by the price before the retracement. If the price revisits this level in the future, this becomes our potential resistance zone. After the retracement, we notice that the price attempts to break this level at least four times over 8 months.
- Points 4 and 5: This area is important because we observe how a resistance zone is later used as a support area. This is known as a Flip from Resistance to Support (Flip R/S), which indicates a potential bullish continuation.
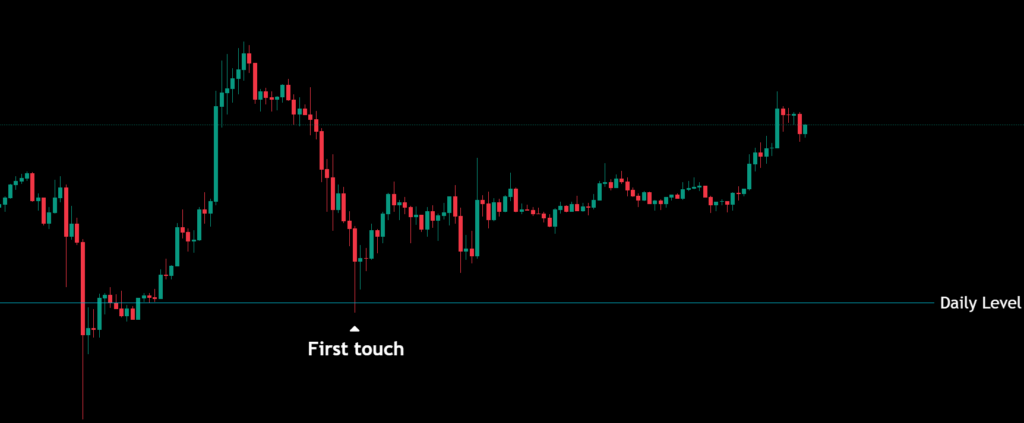
Identify Support and Resistance using Horizontal Levels
Horizontal levels are our favourite method of identifying S/R at Chart Champions. It involves using higher timeframes, such as daily, weekly, and monthly charts, to define support and resistance zones.
We use the horizontal ray in TradingView and the price action. The identification is quite simple. We look at the opening and closing of the candlesticks in the selected timeframe.
- To mark resistance, we need to see a green candle followed by a red candle.
- To mark support, we need to see a red candle followed by a green candle.
After identifying our support and resistance, we move to lower timeframes, like 30 minutes or 1 hour, and analyse the price action and volume once the price reaches these levels. It is always advisable to use this technique alongside other tools to look for confluences and increase the probability of a successful trade.
Bonus 1: Identifying Supply and Demand
As a special bonus in this article, we want to show you a practical way of using supply and demand to identify S/R levels. However, we’ll let Severin, our coach who specialised in this strategy, explain it to you in the following video:
Bonus 2: Identify Support and Resistance using Indicators
Many indicators can help us identify higher-probability support and resistance levels. However, some of the favourites at Chart Champions include VWAP and Volume Profiles.
Identify Support and Resistance using VWAP.
This tool uses volume to generate a line that serves as support if the price is above it or resistance if the price is below the VWAP line.
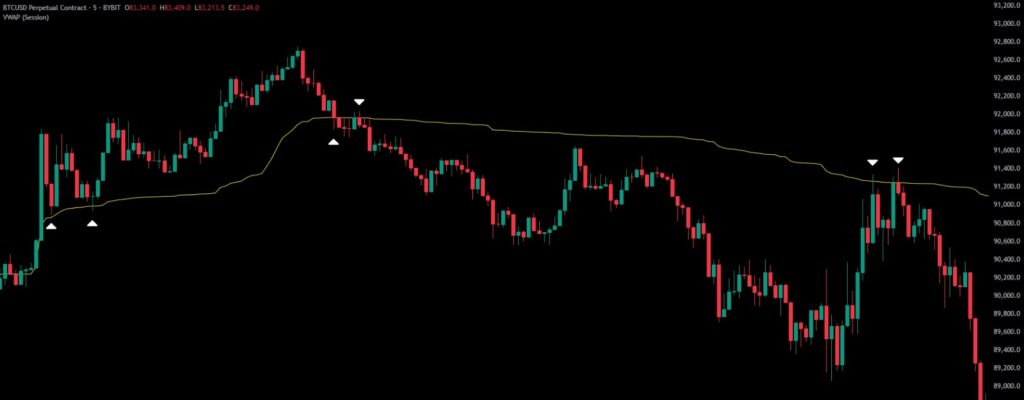
Our preferred timeframe for using VWAP is 5 minutes when trading Bitcoin and 1 to 5 minutes when trading futures like ES or NQ.
Conclusion
These are just four practical ways to start marking S/R levels in trading. Don’t underestimate this simple but powerful technique, which will help you understand the dynamics of any market.
Yes, this technique applies to cryptocurrencies, the stock market, and futures—it can be applied to any market.
At Chart Champions, we have the resources and lessons you need to identify S/R and how to use confluence to your advantage to find high-probability trades, also known as A+ setups!
Don’t miss out, see you inside!