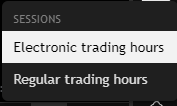
When looking at futures contracts or continuous pairs on TradingView, you’ll see two types of sessions: regular and electronic trading hours.
These sessions let us analyse charts in two different ways, either looking at the full session or focusing only on the regular hours when the market is most active.
In this article, we’ll explain the difference between electronic and regular trading hours, and when it’s better to use one over the other.
What are the ETH and RTH on TradingView?
The electronic trading hour, also known as ETH, is the main full session for the asset. It runs from 22:00 UTC to 21:00 UTC, covering pre-market, post-market, and also includes the New York session.
The regular trading hour, also known as RTH, is a reduced session for the asset. It runs from 13:30 UTC to 20:15 UTC and focuses on the market’s most active hours.
How to Use the Regular and Electronic Trading Hours
When you turn on the RTH session on intraday timeframes (anything below daily), you’ll see “empty spaces” in the chart. This is a gap, and in this case, we call it an RTH gap because it only shows when the RTH session is active on TradingView.
If you want to see the asset’s full session, turn on ETH. This way, the price action will include everything that happens during the trading day.
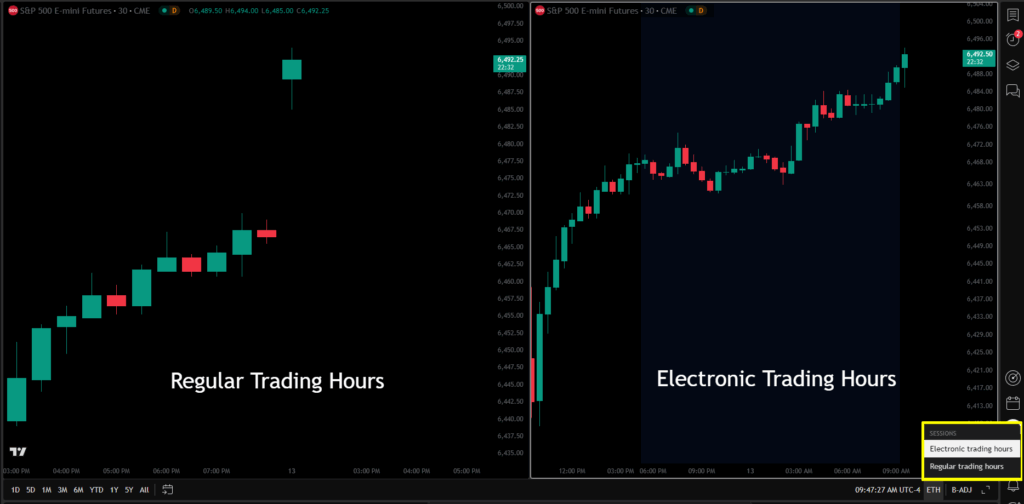
Whether you focus on scalp or day trading, both sessions help you understand an asset’s behaviour.
Always start with the Electronic Trading Hours (ETH) for the full technical context, then use the Regular Trading Hours (RTH) for precision in a shorter session.
Futures traders often rely on RTH levels, but only after reviewing ETH to see the bigger picture. Switching between sessions during analysis and pre-market preparation can give you a strong competitive edge.
RTH Gap vs CME Gap
The CME gap is a gap formed during the ETH session, meaning it takes into account the asset’s full trading hours.
The RTH gap happens because of the shorter regular session.
- CME gaps (ETH gaps). The most studied gaps. These are the same gaps you see forming over the weekend and are key levels for day trading. Learn more about the CME gaps here.
- RTH gaps. More useful for scalp trading because they’re intraday levels that are respected by the market and tend to get filled quickly.
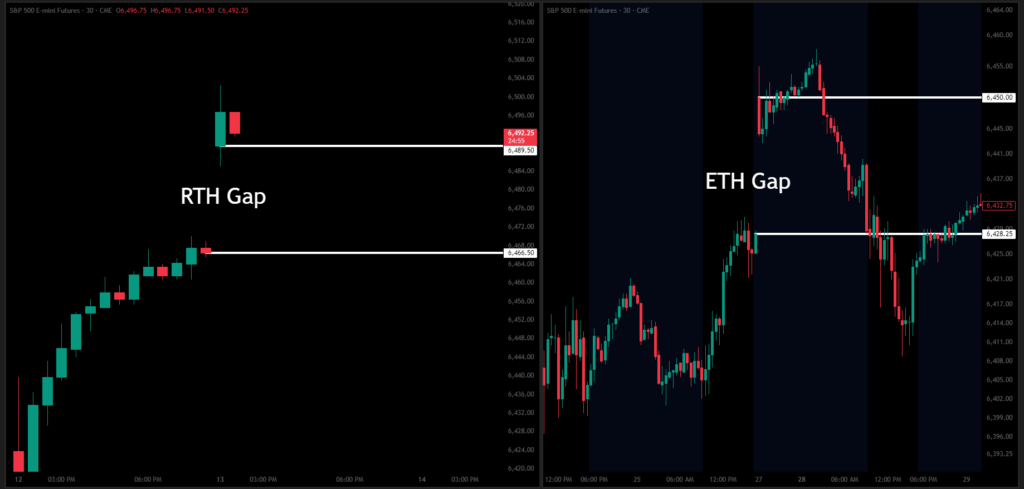
In this example, we can see an RTH gap on the left. This gap formed because the S&P 500 closing price (6,466.50) was different from the opening price (6,489.50), creating an “empty space” on the chart.
On the right, we can see a gap that formed over the weekend. This happens because the market closes on Fridays at 21:00 UTC and reopens on Sundays at 22:00 UTC. Since the closing price was different from the opening price, a gap appeared. A few hours later, this gap was filled.
Regular Trading Hours: Key Levels We Study
At Chart Champions, we track the following RTH levels:
- RTH Gaps: Marked in intraday timeframes. A gap is confirmed if the 13:30 UTC opening price is different from the 20:00 UTC close.
- OHLC RTH: The open, high, low, and close of the RTH session act as important intraday support and resistance.
- Previous RTH Sessions: Reviewing past RTH sessions helps assess daily sentiment using volume profile shapes and value areas.
Electronic Trading Hours: Key Levels We Study
For ETH levels, we focus on:
- Session Opens: The ETH daily open is an important level, especially for scalp trading during the New York session. It acts as a key support or resistance level.
- ETH Gaps = CME Gaps: Marking CME gaps gives us a big advantage. Depending on their position (at support or resistance), they can tell us where the market might be headed.
- Overnight Session: Runs from 22:00 UTC to 13:30 UTC. We mark the Overnight High and Low to find key areas where a liquidity grab might occur.
- Previous Day Values: The previous day’s VAH, VAL, POC, and also OHLC act as strong support and resistance for the current session. Mark them and get ready for your trading session.
Conclusion
Now that you know how to use regular and electronic trading hours more effectively, the next step is to master the key levels we’ve covered here.
If you want to learn how to combine these levels and create a ready-to-execute trading plan, the Champions membership has everything you need.
At Chart Champions, we have detailed classes that cover all the theories and strategies used daily by our coaches (Daniel, Igor, and Severin) across markets from Bitcoin to futures like the S&P 500 and Nasdaq.