


Reading volume and time are essential skills that every trader should aim to master. Decisions based solely on price action can be tricky at times, especially when an asset is trading at all-time highs. In those moments, price action alone paints a bullish picture: higher highs and higher lows across all timeframes.
But what happens when conditions change?
In this article, we’ll break down the full chart context that occurred on May 22, 2025, when Bitcoin printed a new all-time high at $112,000, so you know exactly what to look for in the data to catch the next big setup.
Reading Bitcoin’s HTF Context
When Bitcoin is trading at all-time highs (ATH), tools like Fibonacci can help set potential targets. Still, psychological round numbers also play a critical role.
In this case, $112,000 is a clean, round figure, a magnet for traders and algorithms alike. It’s a natural resistance point.
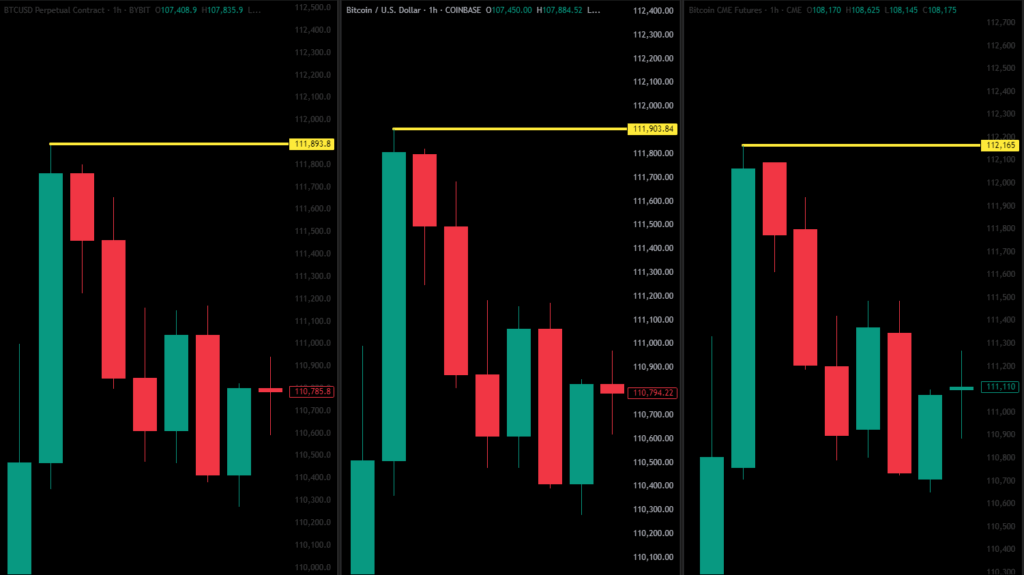
The image below shows the price discrepancies across different exchanges on May 21, when Bitcoin reached its ATH:
- Bybit USD pair: $111,893
- Coinbase pair: $111,903
- CME pair: $112,165
Bitcoin hit an all-time high during the overnight session when volume tends to be thin, and participation is low. It’s when the New York session kicks in that volume pours in, and with it, the setups worth trading.
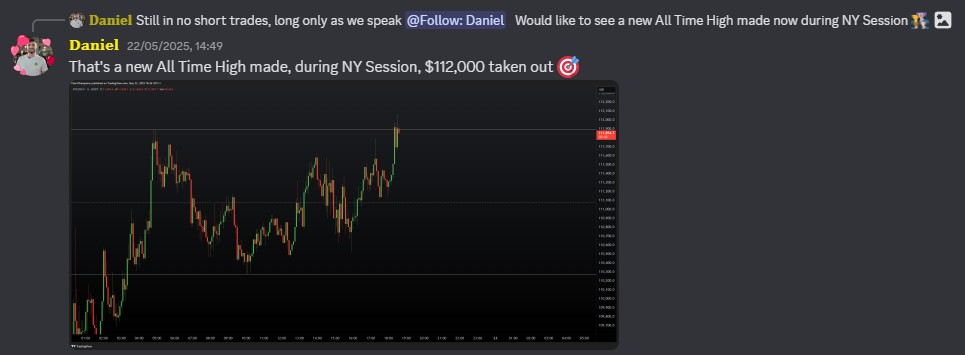
During one of the Chart Champions Daily Updates, Daniel laid out the groundwork, waiting for an A+ setup and exploring multiple possibilities, including an SFP of the overnight all-time high.
From a broader perspective, this move pushed the price into the psychological $ 112,000 resistance across all exchanges, especially during the New York session, when trader intent becomes clearer.
At that moment, reading volume and time can tell us whether the new ATH is accepted or not.
Market Profile Read: Bitcoin
Using the TPO (Time Price Opportunity) structure alongside the volume profile helps us determine whether value is being accepted or rejected, where traders are actually transacting, and how strong or weak the move is.
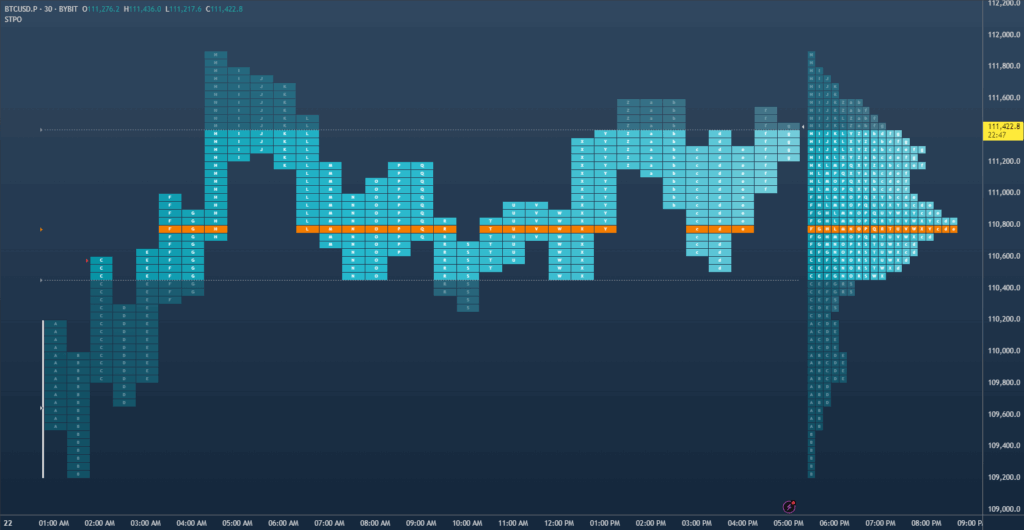
Looking at the TPO Market Profile from that day, we identified several key points:
- P shape profile, signalling that the price moved up quickly and then found balance. The wide top shows fair value was accepted.
- Higher lows. With lows intact, the profile suggests further upside potential.
- Buying tail. Buyers stepped in aggressively, forming a clear buying tail around the 109.2K level to defend that area.
- Poor highs. During the initial attempt at the ATH, the price left a poor high on the TPO profile, an indication that this area was unfinished and likely to be revisited soon.
In the image, we also see the price bouncing off the Session VWAP, a great intraday tool for catching pullbacks and sticking with the trend direction.
All signs pointed to a bullish context, with multiple confluences supporting the idea of higher prices, at least in the short term.
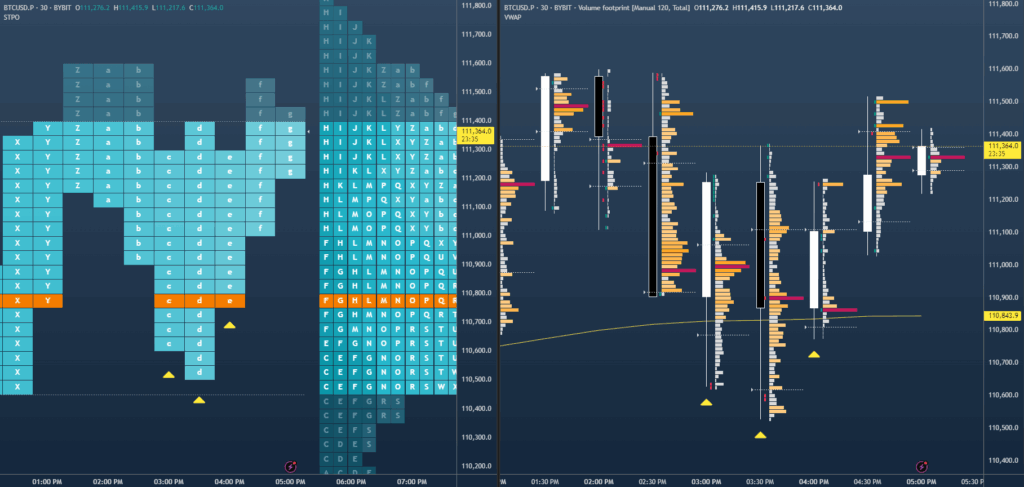
Reading the 30-minute Volume Profile
Alarms go off as Bitcoin hits $112.000, as expected. To understand trader intent, we turn to the volume profile.
We zoomed into the 30-minute timeframe using the free Chart Champions TradingView template, which includes the STPO indicator and Footprint charts, offering everything in one view.
What we found was revealing: an evident lack of volume.
In any trend, we want to see strong volume, which confirms that participants agree on those prices. Igor explains this brilliantly in his recent YouTube lesson on Market Profile.
No volume = no interest.
Even during this second push to ATH, volume remained absent. The profile looked thin compared to previous 30-minute sessions, classic signs of a weak breakout.
Over the next two hours, the price continued trading above the TPO value area, but 30-minute candles still showed low volume.
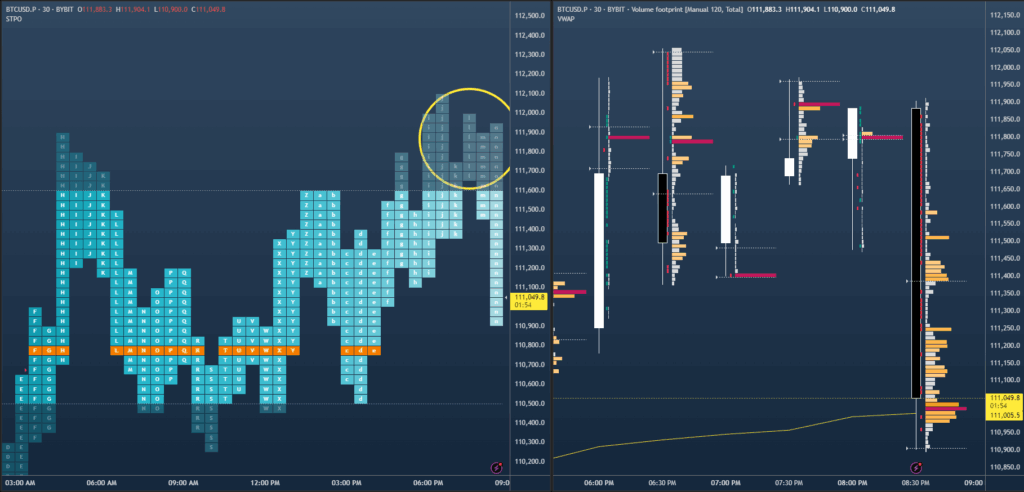
In short, traders had no interest in keeping Bitcoin above $112,000.
Daniel’s Short Trade at $112K
Right then, Daniel executed a scalp short, taking advantage of the opportunity to trade an SFP just below the prior ATH right after the price tapped the psychological resistance. He shared it with all Champion members in the Discord community.
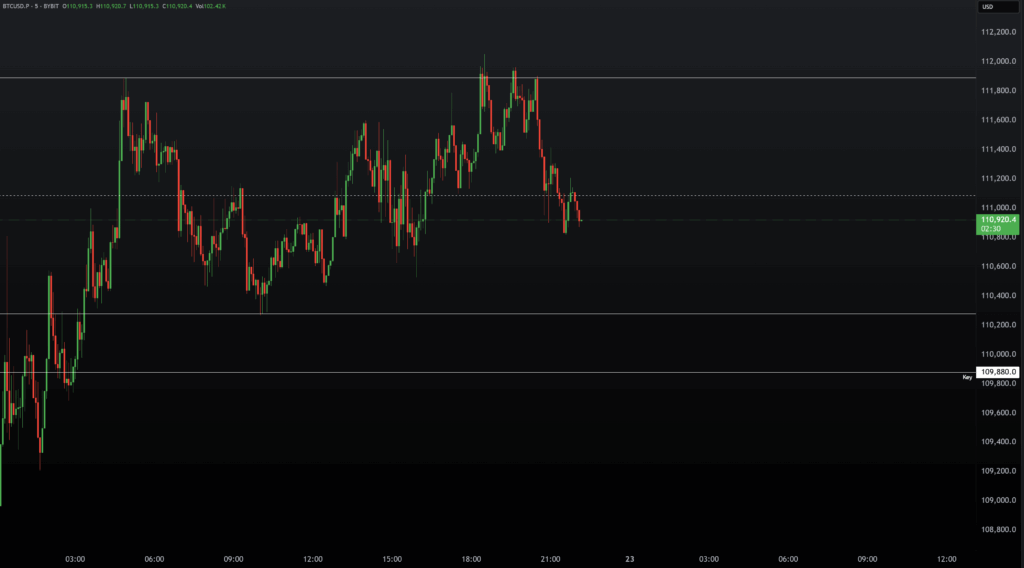
This was a textbook example of trading the chart and setup, not your bias.
The result of analysing volume and time behaviour was a clean rejection, with the price dropping over 4%.
That opened the door to a fresh analysis of volume and price action, where both Severin and Daniel later shared updated key levels on the Chart Champions YouTube channel.
Conclusion
This ATH scenario on Bitcoin was a powerful reminder that price alone doesn’t tell the whole story. While the structure appeared bullish, with higher highs and higher lows, volume and TPO provided the real context.
At Chart Champions, our live sessions and lessons on tools like VWAP, TPO and volume profiles are designed to help traders develop this kind of edge. These are the same tools our coaches use every day, guiding Champion members to read the market with precision, especially around key psychological levels, such as $112,000.
We anticipated the weakness and planned a short with defined invalidation. In the end, this was a trade built on context, confluence, and confidence in the data.
That’s the Champions’ edge.


Leave a Reply