The market structure in trading is effective for understanding the context and direction of any given asset, leading to better trading decisions and improved risk management.
Through market structure, we can determine whether the market is in an uptrend, a downtrend, or in a consolidation phase. Additionally, it can help you identify support and resistance on the chart, liquidity zones, swing highs, and swing lows.
In this article, we will cover everything you need to know to master market structure. If you want to dive deeper into this topic, you can join Chart Champions at any time.
What Is Market Structure?
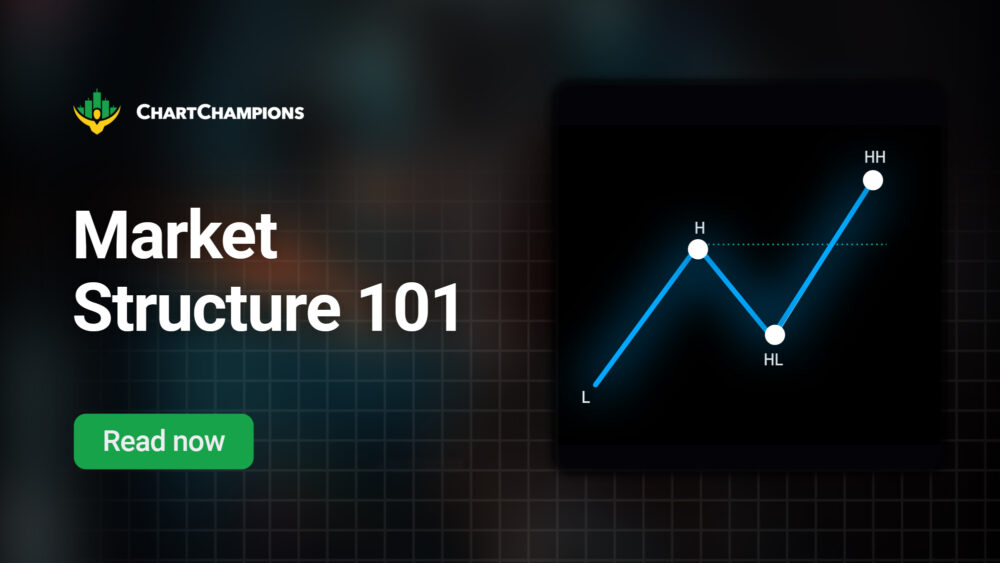
The market structure refers to the way the market flows. It’s a visible pattern created by highs and lows on a chart, revealing the current direction of the market and helping traders understand whether the price is trending up, trending down or moving sideways.
In simple terms, market structure refers to how we interpret the charts.
Before making any trade, pause and ask yourself these key questions:
- Where is the market trying to go? Is it pushing higher with strength or drifting lower with weakness? This tells you the current directional bias, whether bullish, bearish, or neutral.
- Is it succeeding in going that way? Price might attempt to break a level, but does it follow through? For example, if the market forms a higher high but immediately gets rejected and reverses, it might be showing weakness rather than strength.
- Is the market slowing down or reversing? Look at momentum shifts, failed breakouts, or break-of-structure signals. These signs can be early warnings of a potential trend change.
These questions are practical. They help you avoid trading against the trend, identify exhaustion before reversals, and confirm whether a breakout is real or not.
Why is Market Structure so Important in Trading?
The key to the importance of market structure in trading lies in its simplicity and effectiveness in analysing the market.
Many traders struggle with knowing when to enter or exit a position. Additionally, they often focus too much on indicators, such as the RSI, MACD, moving averages, and Bollinger bands, among others. However, most of them are lagging indicators, providing information after the move has already occurred.
Without a clear understanding of whether the market is trending or ranging, trades become random bets rather than calculated decisions.
The market structure is the raw signal beneath everything.
Mastering market structure provides you with the clarity to discern the market’s intentions. It increases your risk-to-reward ratio and supports smarter decision-making.
Market structure is essential because:
- Build Trade Bias. It gives a clear directional bias (bullish, bearish or neutral).
- Improves Entries and Exits. By aligning with the trend, you avoid random trades and increase the probability of success.
- Supports Risk Management. Knowing where swing highs/lows are lets you place more accurate stop-loss and take-profit levels.
- Boosts confidence. Understanding what price is doing and why helps you stop guessing and start executing trades with intent.
The Three Types of Market Structure
The market has three potential market structures:
- Uptrend
- Downtrend
- Range or Consolidation
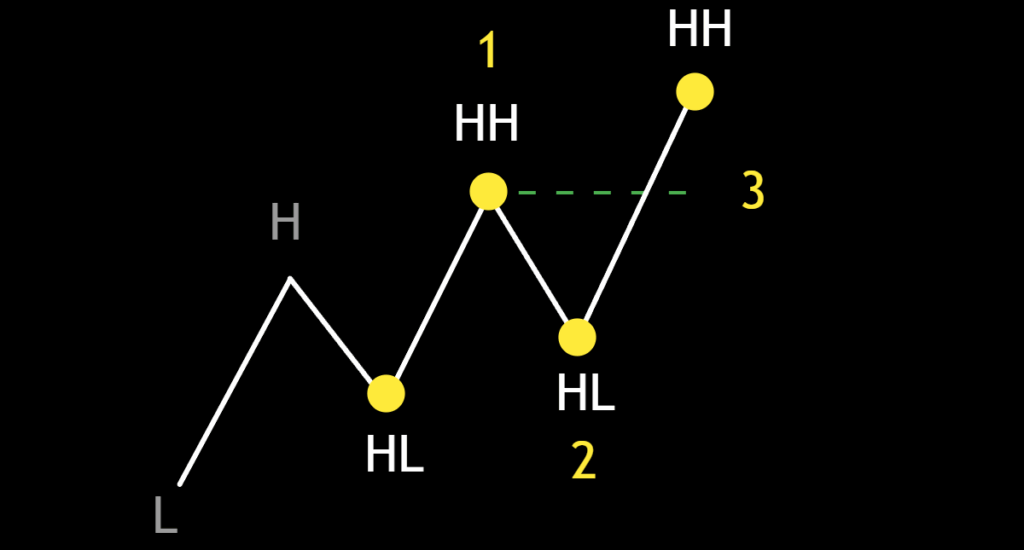
The Uptrend
Higher highs and higher lows characterise an uptrend in trading, and it suggests that buyers are in control. The context of an uptrend is ideal to look for long entries.
The confirmation of an uptrend requires three steps:
- A higher high (HH)
- A higher low (HL)
- A break above the previous higher high
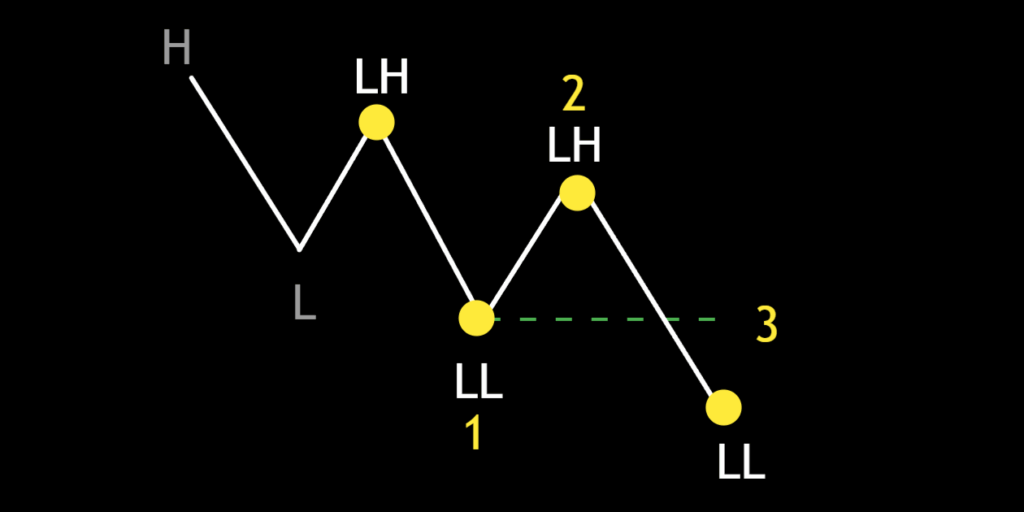
The Downtrend
Lower highs and lower lows define a downtrend in trading, indicating that sellers are dominating the market. The context of a downtrend is ideal to look for short entries.
The confirmation of a downtrend requires three steps:
- A lower low (LL)
- A lower high (LH)
- A break below the previous lower low
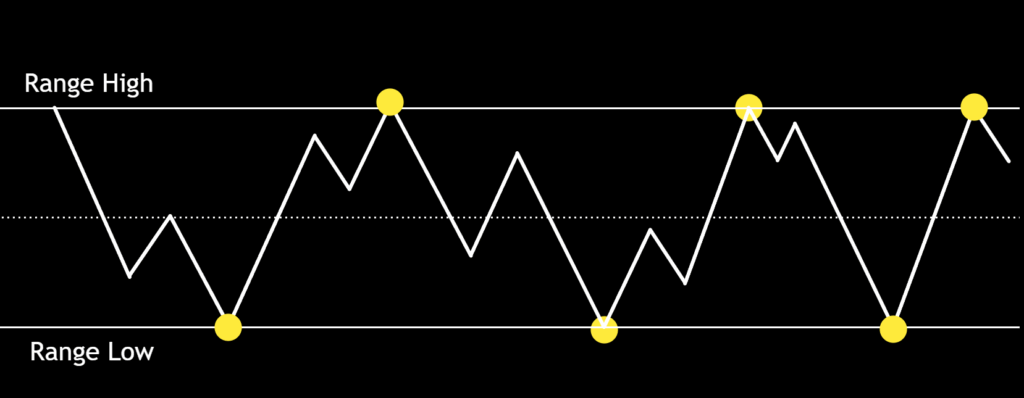
Consolidation or Range
The price moves sideways within a horizontal boundary, with neither buyers nor sellers dominating the market. In a range environment, false breakouts are more likely to occur.
To spot a ranging market, traders must:
- Look for equal highs and equal lows
- Use horizontal channels or trendlines to mark range boundaries.
The markets are not always trending. In reality, markets spend the majority of the time, around 70% to 80%, in a ranging or consolidating phase. In this phase, it’s challenging to get a clear trend.
Here’s why learning to trade ranges is so valuable:
- Consistency: Since ranges are so common, mastering them provides more frequent trading opportunities.
- Defined risk zones: Ranges allow you to clearly define support and resistance levels, making it easier to place stops and targets.
- Early trend detection: The end of a range often signals the start of a new trend—being positioned early can offer a significant edge.
A widespread and highly effective setup at Chart Champions is the Swing Failure Pattern (SFP), which is traded when the market is in consolidation. The SFP is one of many setups for ranging environments that can be found in the Chart Champions courses.
Internal Structure Shifts in Trading
To master market structure, it’s essential to recognise the fractal nature of the market and the internal structure that can occur within impulsive movements.
Let’s be honest, real-world price action isn’t always textbook-perfect. The internal structure shifts exist. They are short-term fluctuations that may appear like trend changes but are just minor corrections or consolidations within the larger trend.
How to approach internal structure shifts:
- Zoom out to a higher timeframe to get perspective on the major pivots.
- Ignore minor fluctuations that don’t break key structural levels (the high or low that initiated the trend)
- Prioritise the swing low that initiated the move breaking a previous high (or the swing high that broke a previous low).
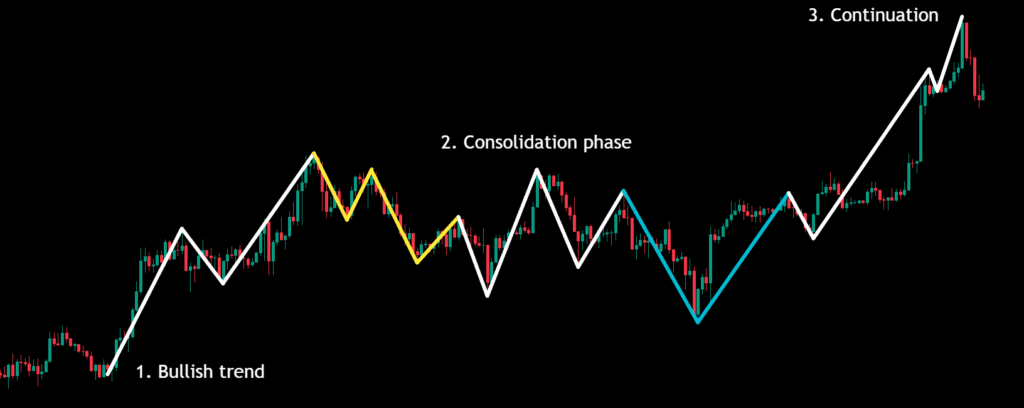
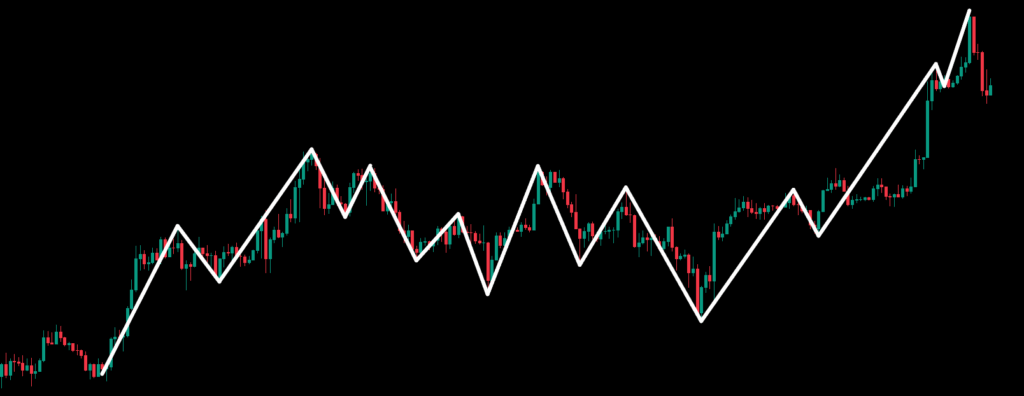
In this example, we can identify a bullish trend (1), which sets our initial context as bullish. After a strong impulse move, it’s common for the price to enter a consolidation phase or range (2).
The yellow lines highlight a potential change in market structure. If we zoom in on a shorter timeframe, this shift becomes clearer.
However, the larger trend remains intact without any significant low being taken. So, while we’re seeing signs of a possible short-term shift, the overall context continues to favour the bulls.
In the blue lines, we see the range lows being swept, followed by the price gaining acceptance back into the range. This move concludes with an impulse to the upside, confirming trend continuation (3).
Pro Tip: As long as the major pivot that caused the breakout remains intact, the overall trend is considered valid, even if the price temporarily forms what appears to be a counter-trend.
How to Spot the Best Swing Highs and Swing Lows
The swing highs and lows are pivotal turning points that indicate when a trend begins. Identifying swing highs and swing lows can be challenging for new traders, but once mastered, it can significantly improve your stop-loss placement.
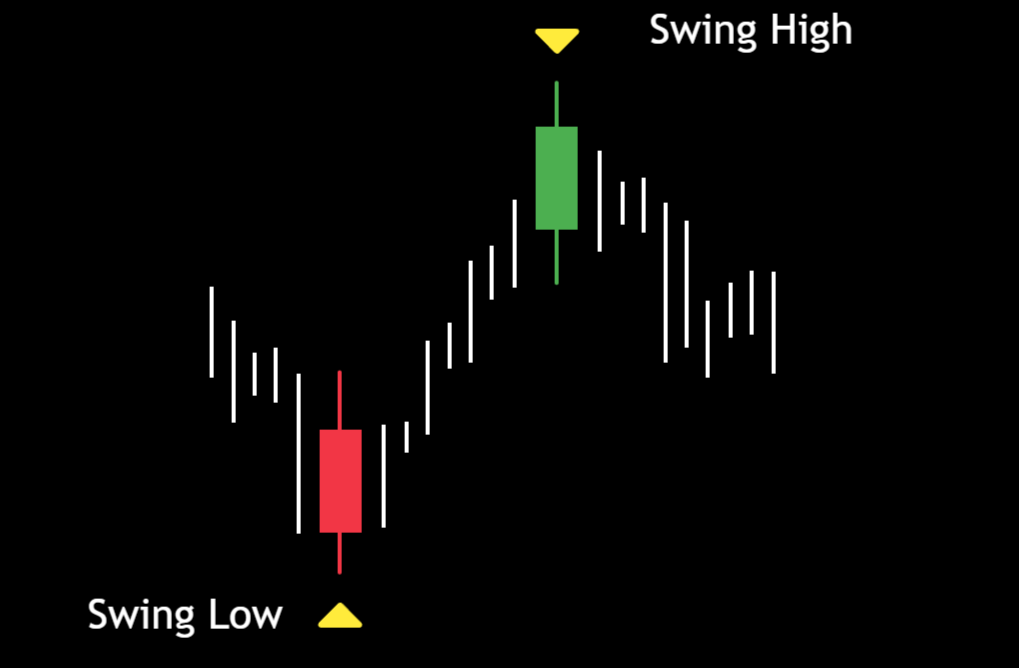
- A swing high is a local maximum where the price temporarily peaks before reversing downward. In market structure analysis, a swing high is a central candle surrounded by two lower candles.
- A swing low is a local minimum where the price reaches its lowest point before moving upward. In market structure analysis, a swing low is a central candle surrounded by two higher candles.
Fractal Indicator by Igor-T
The correct identification of swing highs and swing lows is crucial, and this is where our Fractal indicator becomes useful.
The Fractal Indicator (by Igor-T) is a technical analysis tool that automatically highlights these critical points by spotting patterns in price action where a reversal is likely to occur.
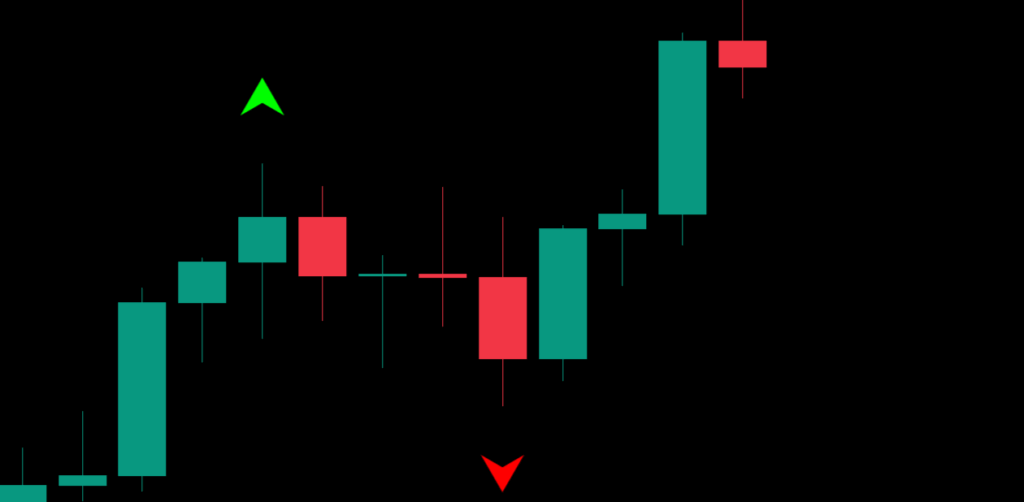
It prints a new arrow where a swing high or low is formed.
How to use our Fractal Indicator:
- On TradingView, search for “Fractal” indicator. Select our popular Fractal indicator by Igor-T. (Yes, Igor from CC!)
- The indicator will mark swing highs with green arrows and swing lows with red arrows.
- These reference points help confirm quickly where the swing highs and lows are placed.
- Combine fractal signals with volume analysis to validate breakouts and filter out noise.
As we always say at Chart Champions, do not rely solely on this or any other indicator. Our fractal indicator is most effective when used in conjunction with other tools, such as support/resistance zones or trendlines.
Conclusion
The market structure enables you to interpret price action, providing the necessary context to align with trends, identify potential reversals by spotting the best swing highs and lows, and manage risk effectively in ranging markets.
By identifying key swing points and recognising structural shifts, you move beyond guesswork and develop a disciplined, strategy-driven approach to trading.