A trend change represents the moment when an asset shifts direction, turning from bullish to bearish or vice versa. Recognising this transition early can help traders lock in profits, avoid unnecessary losses, and position themselves ahead of the next move.
In this article, we will break down how to identify a real trend reversal using swing highs and lows as structural pivot points, along with confirmation techniques that separate noise from signals.
What is a Trend Change?
A trend change occurs when the market transitions from an uptrend to a downtrend or vice versa. Market trends generally aim for continuation, but no trend lasts forever.
Within every trend, there are natural pullbacks and corrections, which are not necessarily signs of reversal.
So, how do you know when a real trend change is happening?
Ask these two key questions:
- Is the market doing a good job continuing in its direction?
- Has it failed to make a new high or low as expected?
The first sign of weakness often appears when a swing low fails to create a new higher high (in an uptrend), or a swing high fails to create a new lower low (in a downtrend).
This breakdown in structure is your cue to start watching more closely, as the market is not doing a good job of continuing its direction.
The 3-Step Confirmation of a Trend Change
At Chart Champions, we use the following sequence of events to confirm a trend change:
- Break of Structure. The previous swing low (in an uptrend) or high (in a downtrend) is taken out.
- Formation of a lower high or higher low. The market fails to reclaim the trend’s momentum.
- Break of the new structural level. The price moves beyond the newly formed lower low or higher high, confirming a reversal.
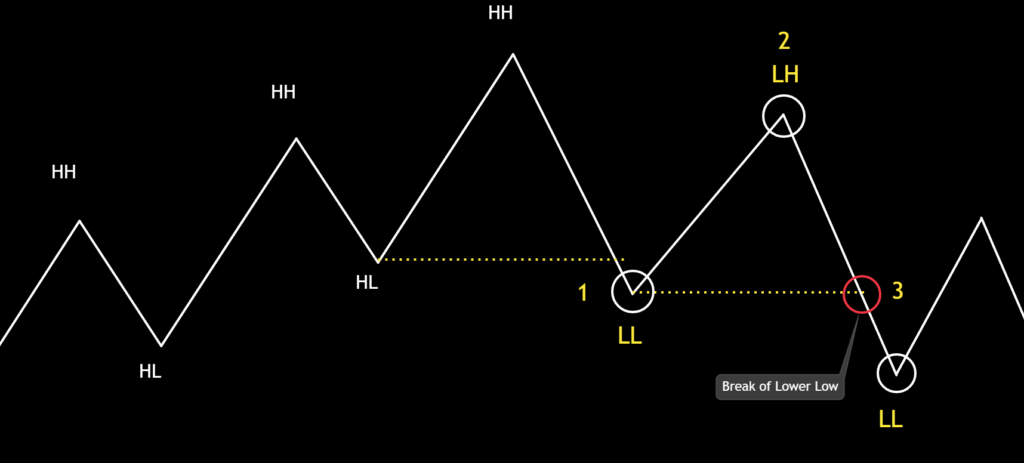
This example highlights the three-step confirmation of a trend change by breaking the previous higher low (HL). The price fails to generate a new high, now forming a lower high (LH). Then, the price breaks the new structural level by taking the previous lower low (LL).
Practical Example: From Uptrend to Downtrend
In this example, we can see price forming a classic uptrend, made up of higher highs (HH) and higher lows (HL). However, something changes when, instead of creating a new HL to continue the trend, price fails and breaks below the last HL that created a HH, effectively breaking the bullish structure.
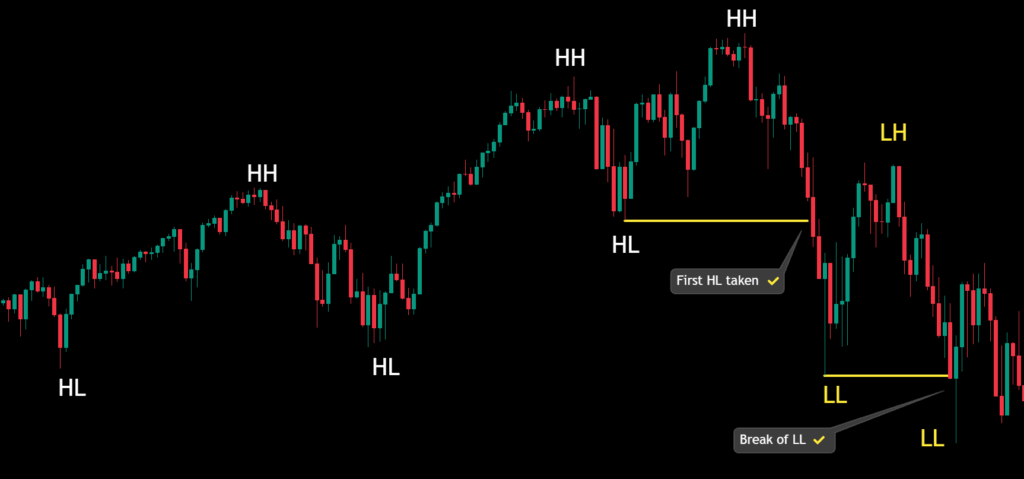
The price breaks through two previous higher lows, showing a strong drop from the recent highs. This is the first signal that something is shifting structurally in the market.
Now, we need to see the price failing to make a new high, and instead form a lower high (LH)—this is the second step.
Finally, the trend change is confirmed when the price breaks below the previous lower low (LL). From this point forward, we expect the market to continue forming a sequence of LH and LL.
Trend Changes and Timeframes
When looking to capitalise on a trend reversal, it’s important to consider the timeframe, especially if you’re trading with leverage.
Since a confirmed trend change requires three structural steps, your stop-loss may need to be placed further from your entry. That’s why refining your risk management is essential for this type of strategy.
A good practice is to always perform higher timeframe analysis to spot significant trend shifts, using charts like the 4H, 8H, or Daily.
The choice of lower timeframes depends on your trading style and strategy. If trading cryptocurrencies and an asset reaches a high-timeframe support or resistance level, look for trend changes on the 4-hour chart.
For intraday levels, the 30-minute chart is often effective and practical for spotting structure shifts, especially for altcoins.
Conclusion
Trend changes are about confirmation. At Chart Champions, we emphasise the importance of following the three key steps:
- Break of structure.
- Formation of a lower high or higher low.
- Break of the new structural level.
Keeping these steps in mind allows you to avoid giving back gains to the market through emotional or premature trades. These concepts are part of the structured methodology we teach in our courses.
If you want to delve deeper into this knowledge, join our Chart Champions community and continue learning alongside traders who master these techniques every day.