To build a successful trading career, it is essential to develop strong planning skills. This ability helps us structure our trades, providing more clarity in the days ahead. We will know the best price levels to wait for, considering the different possible scenarios, adapting to the constant changes in the market, and reacting accordingly. I can confidently say that developing a trading plan over time enriches our experience in reading the market.
Each trader has a unique style, and our strategy generally comprises equally unique elements. These elements vary according to our preferences, what makes us feel comfortable, which tools and theories work for us, and lastly, the circumstances we are experiencing. Each element shapes our style, strategies, and how we apply them.
On this article
ToggleGetting In The Zone: Start Planning Skills in Trading
Building a trade from scratch is a habit I’ve successfully integrated into my routine and enjoy every minute of. This requires dedicated time for our attention to be focused on the charts. You may be familiar with that special state of being ‘In The Zone’.
Choosing a specific day and time of the week to conduct our analysis is important to start building this trading plan. The frequency of this analysis will depend on your trading style: Swing trading, Scalping, or Day trading.
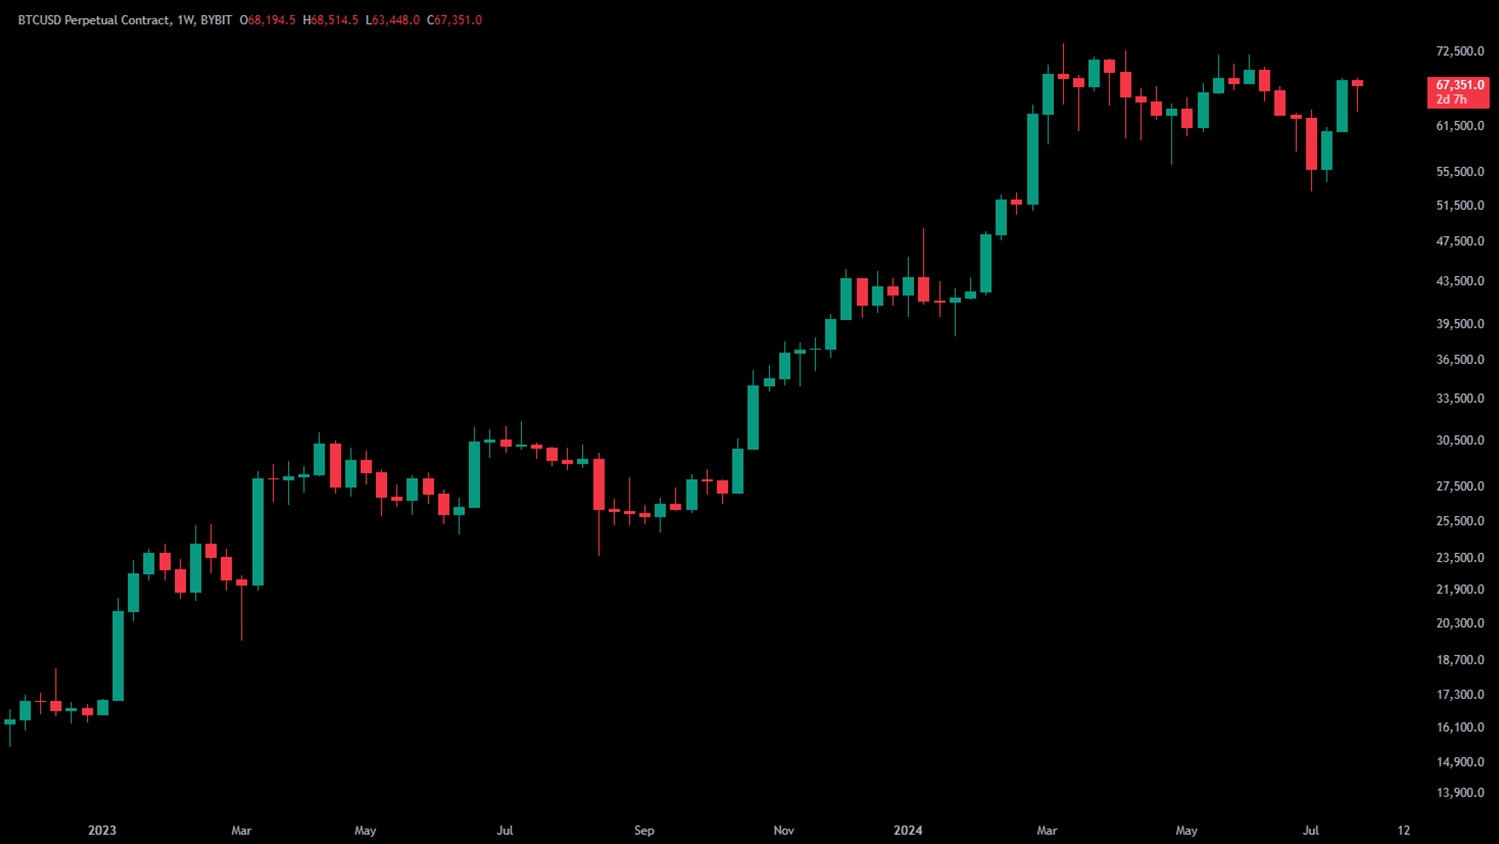
For swing trading, it’s common to plan weekly. With scalping and day trading, we generally work on a daily trading plan. Regardless of your trading style, incorporating high and mid-timeframe levels into your plan is crucial to build the context.
The power of the High time frame
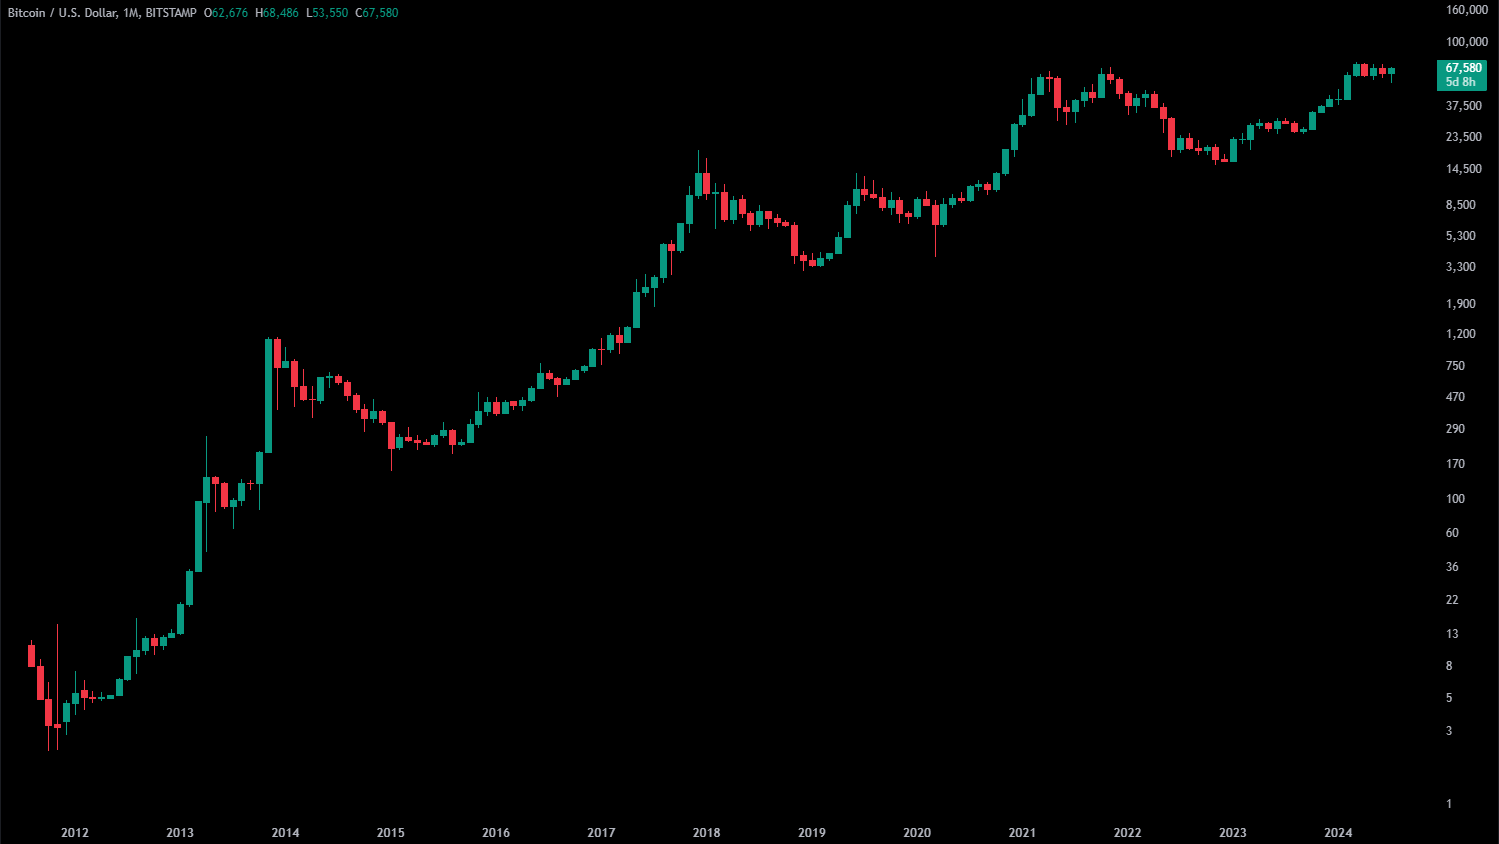
Gaining perspective from higher timeframes gives a clearer picture of the market context. As traders, we can better understand the trends and major price levels, providing valuable insights for future movements. With time and experience, we will align short-term trading decisions with the larger trend, improving the overall effectiveness of a strategy.
While checking the higher timeframes, I also look for the best way to answer the following questions as they are part of my strategy:
- Is the market trending?
- Is the market within a range?
- Has the market reached a resistance or support area?
- Where are the liquidity levels?
Bitcoin – Monthly View – 13 years perspective

The market structure is the simplest and most effective way to get the answer. However, we can still apply any other indicator that can help us understand where the market is trying to go.
We could mention the EMA 200 on a Daily timeframe as it’s well known for being a great area of support when the price is trending up or a great resistance when the market is trending down.
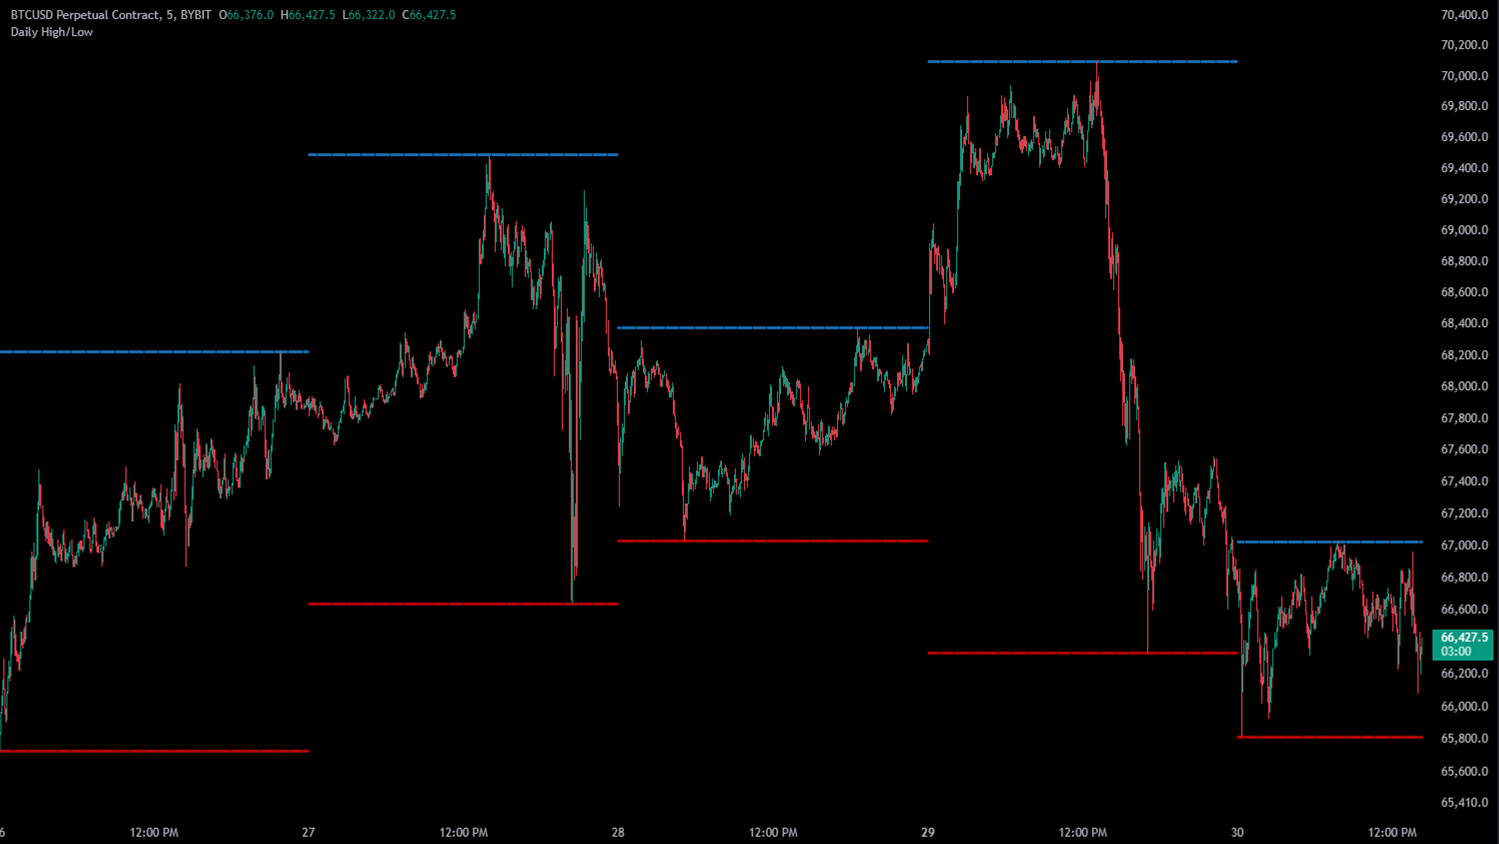
The daily highs and lows indicator is one of my favourite indicators as it makes it easy to detect market structure and whether the market is trending or ranging. It will simply mark the highs and lows of the day and previous days. We can also set realistic expectations for our income or adjust the risk-reward ratio accordingly.
Daily Highs and Lows indicator – 5 days perspective

Breaking down the timeframe
We began with the higher timeframes, which are considered anything between monthly, weekly and daily perspectives. Even a yearly perspective can be valuable for newcomers to an asset. Once the highest perspective in the market is covered, it’s important to narrow down to shorter timeframes and dive into the market dynamic from a daily perspective.
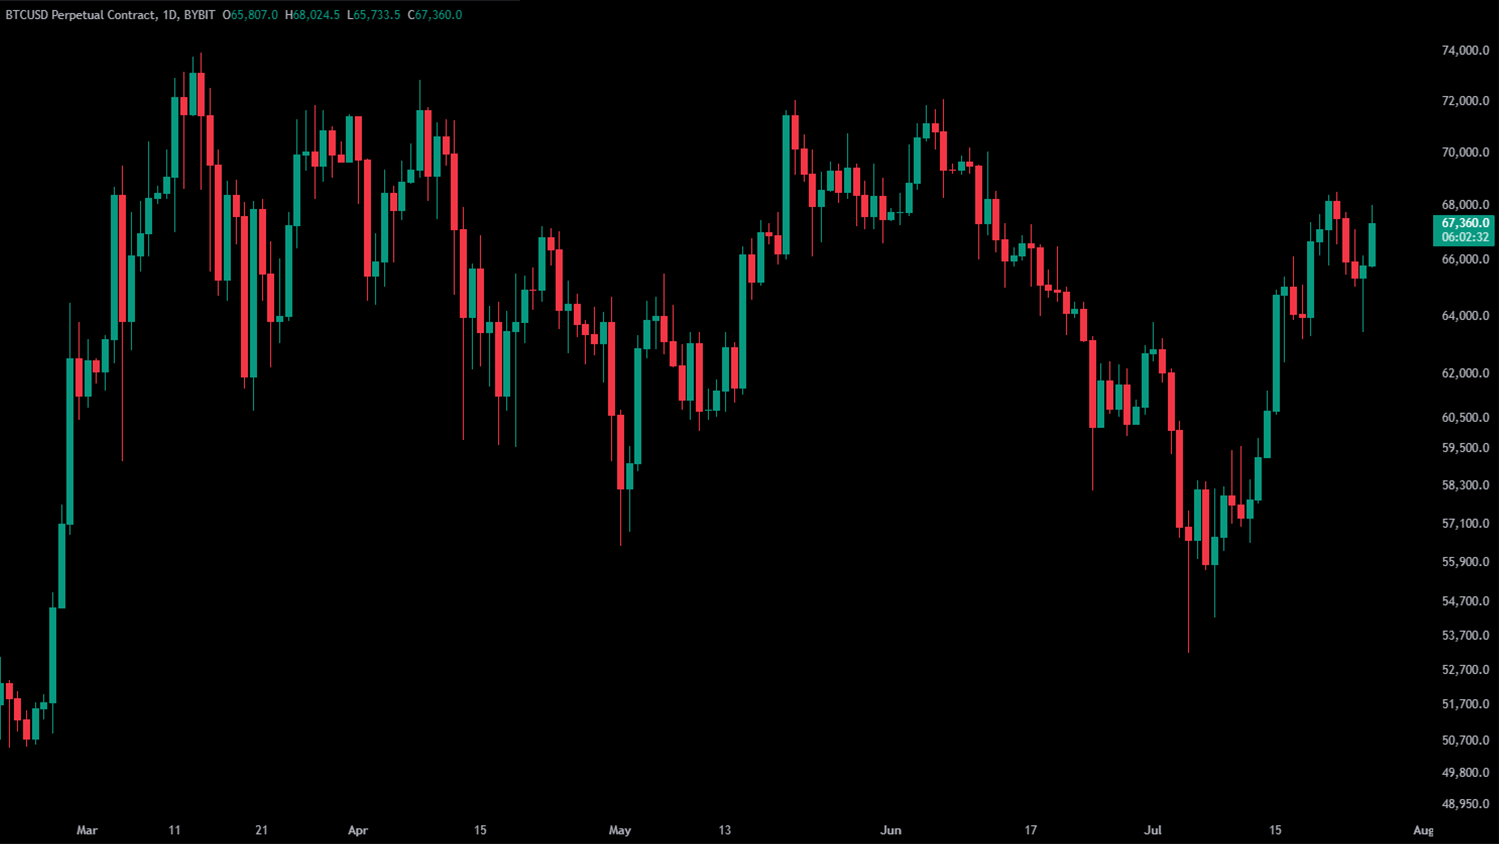
Bitcoin – Daily View – 4 months perspective

We can better understand the market’s current state within a daily session. Examining a daily timeframe, a perspective of 2 – 4 months is sufficient to grasp the overall trend. At this point, we begin to apply various strategies, theories, and tools to analyse the market and play with probabilities, as many trading theories are effective on hourly timeframes.
Building the context of a daily plan
There are as many ways to get market context as there are trading strategies. For day traders using the Volume profile theories, the relationship between the daily open and the previous day’s value areas is a crucial edge. This relationship offers a high probability of predicting the next potential move on the market.
For scalping futures traders, market sentiment can be gauged using the settle price. If the price is above the settle, we could expect higher prices for the current session. If the price is below the settle, then we expect lower prices. Similarly, depending on the current price level, the VWAP indicator can act as support or resistance during a scalping or day trading session.
Bitcoin – Weekly View – 1.5 years perspective

To build a market context, a solid strategy foundation is essential. This foundation gives you the edge by making you aware of the probabilities during the trading session, helping you determine whether you should favour short or long positions.
In a ranging market, we generally favour positions at the edges of the range. We look for shorts near resistance and longs near support, as the best trades are often found around these levels.
There is no hard rule for determining the market context. You might use profile theories, analyse price action through market structure, or employ indicators that have proven effective in your strategy. As mentioned before, there are many ways to get the market context.
The visualisation of the trades
After writing out our daily or weekly plan, visualising the trades that we could take is essential for completion. After seeing the number of confluences on certain areas of the chart, we start visualising the long and short trades that align best with our key areas.
It may seem difficult initially as we are talking about a price action that has not even occurred. All we have is a few lines and tools crossing across the charts. In this situation, the best to do is to start collecting data: create a journal and gather the statistics of each tool and strategy you apply to the markets. As discussed before, this will help you to build your confidence in trading.
Write a plan for all the situations you want to see in the charts to execute long trades. Apply the same process for short trades. Write the price levels, write the name of the strategy, draw a few lines and recreate the price action you want to see to execute your trade. If possible, take the time to save a screenshot of the chart.
Not only the entry levels are crucial. Taking the time to develop a solid exit plan will improve the trade’s management, as we already know the best areas to start taking profits or where the ideas’ invalidations are.
The importance of planning skills in Trading
Over time, we will find that planning our trades further enhances our trading confidence. Focusing on the most effective tools and strategies helps us become better at analysis. What I find great about this routine is how easily one can improve as we progress, starting by reducing the time needed for planning and refining our ability to read the market.
I’ve been able to reduce the time to roughly 40 minutes. Now, I dedicate less than one hour a week to review the market and write out my plan. The rest of the days are spent quickly reviewing the current situation according to my key levels or just waiting for the alarm to be activated. I have decided in advance to enter the market only after reviewing the new data of the day.
Write your plan, set the rules and let the trades come to you.


Leave a Reply