There are three powerful free TradingView indicators that we use every day at Chart Champions to study volume effectively: Fixed Range Volume Profile, VWAP, and Anchored VWAP.
It’s not just about using these tools individually. It’s about learning how to combine them for solid technical analysis that helps you build strong arguments for your next trade setup.
Technical Analysis: VWAPs and Fixed Ranges
At Chart Champions, we have complete lessons dedicated to each of these tools, all of which are available for free on TradingView. You don’t need a paid license. Everything is accessible and ready for you to explore.
The setups we’ll explain below use VWAP, Anchored VWAP, and Fixed Range Volume Profile (FRVP), tools we most commonly apply in the Bitcoin market. That said, they also work great for analysing altcoins.
Our coach, Severin, has shared his personal altcoin strategy with the community in a recent YouTube video.
Finding the Tools in TradingView
You can find both the Anchored VWAP and FRVP in TradingView’s drawing toolbar, located on the left-hand panel. Look under the section called ‘Forecasting and Measurement Tools’.

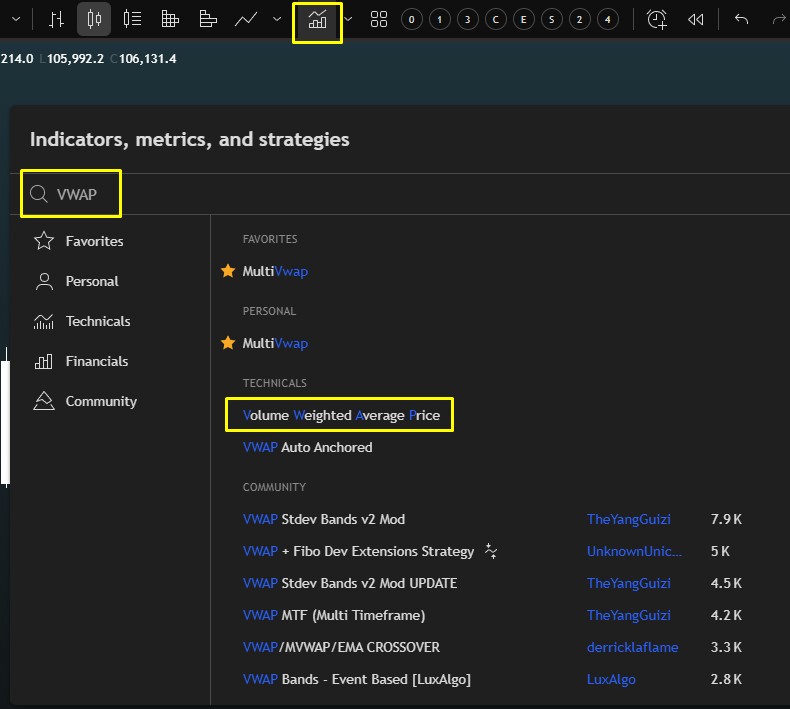
The Session VWAP, on the other hand, is a built-in indicator. To add it to your chart, go to the top panel and click on ‘Indicators, Metrics & Strategies‘. In the search bar, type ‘VWAP’ — you’ll see an option called ‘Anchored Weighted Average Price’. Select it to apply it to your chart.
Best Fixed Range Volume Profile Pulls
The Fixed Range Volume Profile (FRVP) is a highly versatile tool that lets you select any portion of the chart to analyse its volume distribution. Traders typically apply it in two key contexts:
- Trends. These are impulsive moves either to the upside or downside. They contain valuable information about market participation during directional moves.
- Ranges. Consolidation zones are also great areas to apply FRVP and study volume clustering.
In both cases, this tool answers a key question: At what price level did most of the trading volume occur?
This is crucial when identifying support and resistance levels, as well as high-probability trade zones.
Best Anchored VWAP Pulls
Whether the market is trending or ranging, the Anchored VWAP is a fantastic tool for identifying areas of confluence.
These are some of the best points to anchor your VWAP:
- Start and end of a trend
- Tops and bottoms of ranges
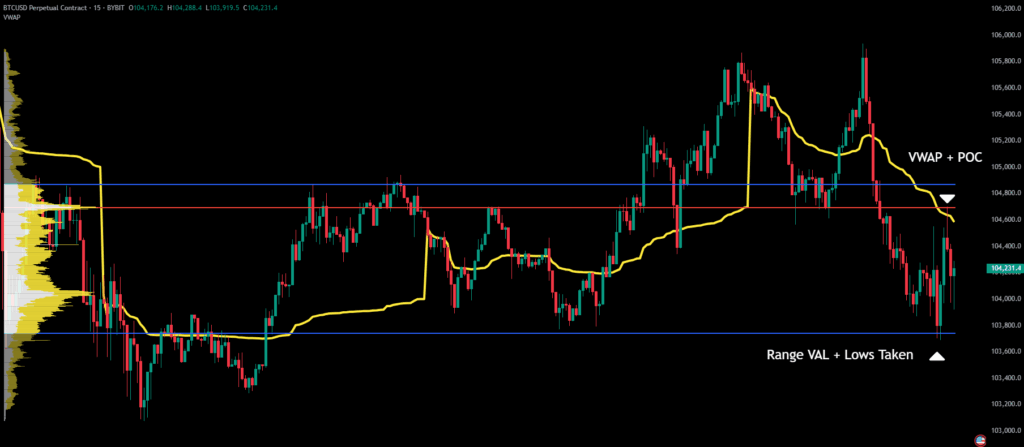
In the example below, the POC of the Fixed Range aligns with the Anchored VWAP, pulled from the bottom of a range, providing a highly reliable support zone. These are the kinds of confluences we look for in strong setups.
Another example shows a bullish impulse in Bitcoin. Anchoring the VWAP from the beginning of the trend aligned it with the trendline and the Value Area Low of the range, further validating the bullish structure.
A second Anchored VWAP, pulled from the bottom of the range, aligns with the POC from the FRVP, providing us with two solid support zones to monitor if the price pulls back.

When to Use Session VWAP
The Session VWAP is a go-to tool for setting take-profit targets. It acts as a key support or resistance level, especially during the opening of the New York session.
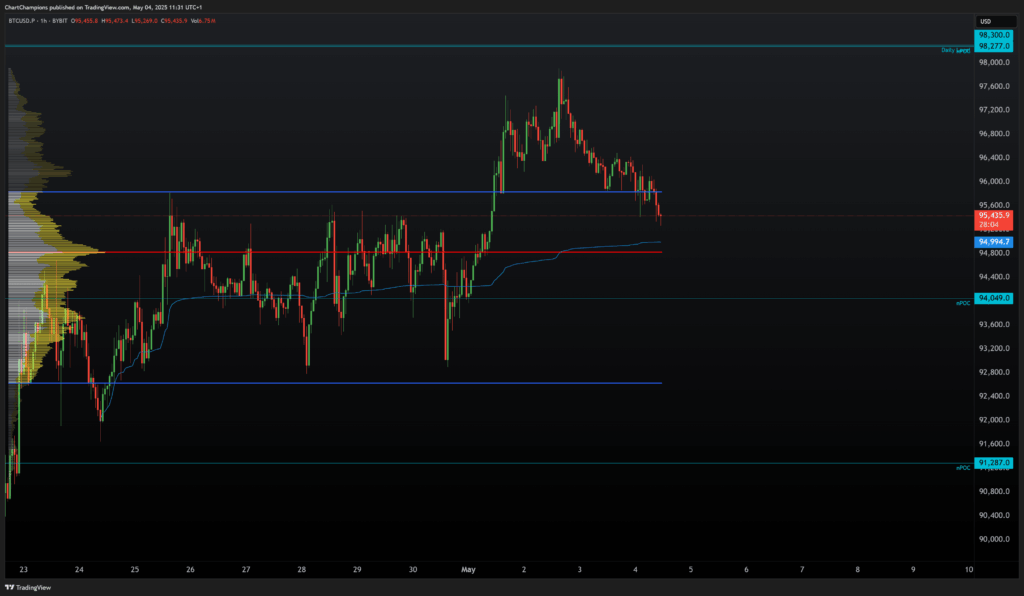
In the example below, Bitcoin consolidated over the weekend. Once the NY session opens on Monday, the price sweeps the previous day’s lows, tapping into the Value Area Low of the range.
The price then bounces and climbs towards the Session VWAP, which acts as resistance and provides the first take-profit level for intraday traders.
Conclusion
If you’re looking to level up your volume-based analysis without paying for premium tools, these three tools are all you need to get started. Combine them, study confluences, and apply them to both trending and ranging markets, just like we do every day at Chart Champions.
Want to learn how we use these tools in real-time market conditions? Join our community and gain access to in-depth coaching sessions that break down every detail.