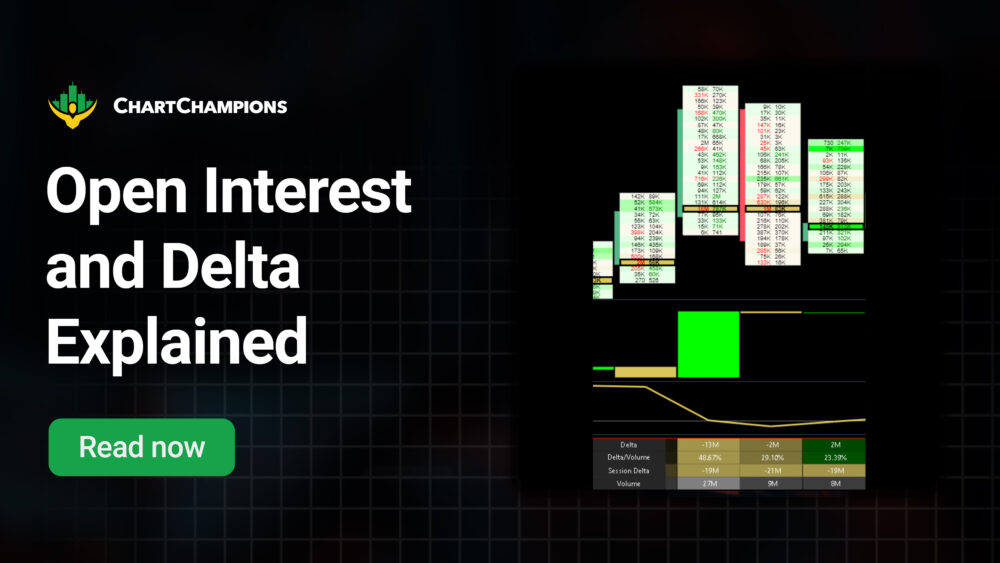
To understand what’s happening behind the scenes of trading futures or crypto, you need to look at the data that tracks trader behaviour and market positioning: Open Interest and Delta.
Once you understand how to read them, they become game-changing indicators. These powerful tools reveal whether money is flowing into or out of the market and whether buyers or sellers are in control.
In this article, we’ll cover what Open Interest means, where you can access it, and how to read it across different markets. We’ll also explain Delta, and finally, show how combining both gives you stronger trading decisions.
What is Open Interest?
Open Interest (OI) measures how many futures contracts are currently open in the market (both longs and shorts). It shows whether new money is flowing in or existing positions are being closed.
- OI increasing: New contracts are being opened. Fresh participation is entering the market.
- OI decreasing: Contracts are being closed. Traders are reducing exposure.
How to Read Open Interest
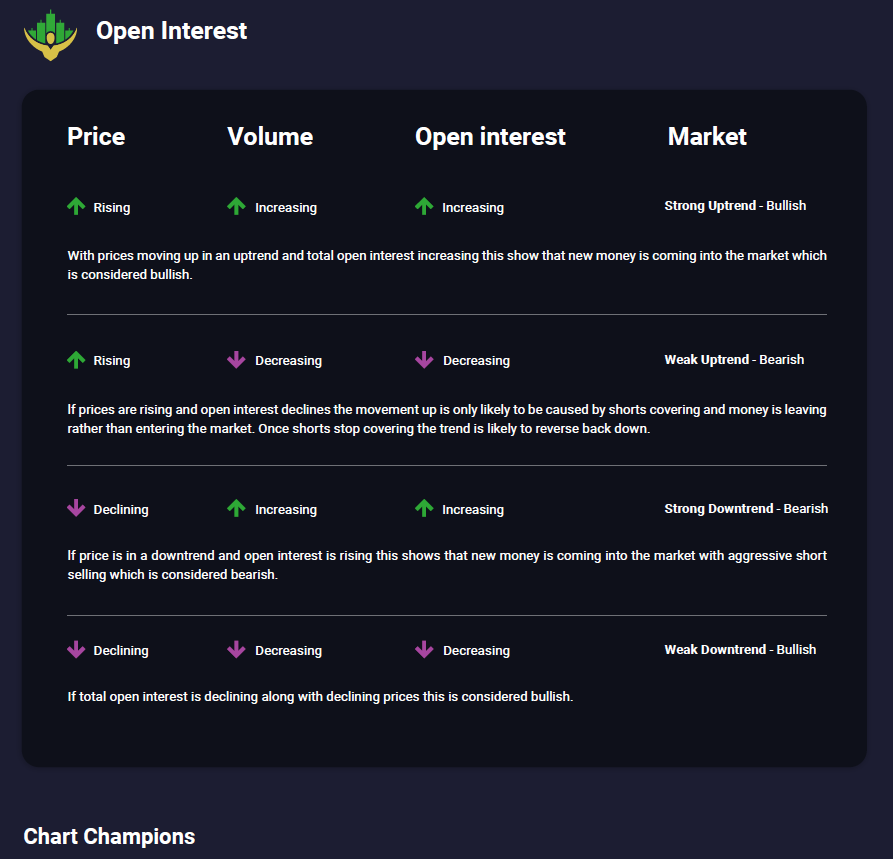
To read OI, you need to consider Price, Volume, and Open Interest together. The interaction between these three tells you the story behind the move:
- Price Rising + Volume Rising + Open Interest Rising: Strong uptrend, new money backing the move (bullish).
- Price Rising + Volume Decreasing + Open Interest Decreasing: Weak uptrend, likely fuelled by shorts closing out (bearish).
- Price Decreasing + Volume Increasing + Open Interest Increasing: Strong downtrend, new money entering short positions (bearish).
- Price Decreasing + Volume Decreasing + Open Interest Decreasing: Weak downtrend, move may be near exhaustion (bullish).
In fast moves up or down, OI often drops because positions are being stopped out. This mass liquidation adds extra fuel to the move.
For a healthy trend, OI should rise with price and Volume.
- In an uptrend, rising OI confirms conviction as new longs step in.
- In a downtrend, rising OI confirms conviction as new shorts join.
- If price rises but OI falls, it’s often shorts being stopped out, meaning not real buying strength.
What is Delta?
Delta measures the net difference between market buys and market sells in a session:
Delta = Market Buys – Market Sells
It shows whether buyers or sellers are in control of the candle, and it’s advantageous when looking for breakouts or reversals at key levels.
How to Read Delta
Delta can be positive or negative:
- Positive Delta: buying pressure dominates (aggressive buyers).
- Negative Delta: selling pressure dominates (aggressive sellers).
Just like OI, Delta should be read in context with price. Here’s the basic framework:
- Green candle + Positive Delta: Strong buying participation. Buyers dominate.
- Red candle + Negative Delta: Strong selling participation. Sellers dominate.
Understanding Delta Absorption
With Delta, we can also spot absorption.
Absorption happens when aggressive orders fail to move the market as expected. This shows that strong limit orders are sitting on the other side, “absorbing” the aggression.
Examples:
- Red candle + Positive Delta: Sellers push price down, but heavy limit buys absorb the selling.
- Green candle + Negative Delta: Buyers push price up, but strong limit sell walls absorb the buying.
At Chart Champions, we prefer using Cumulative Volume Delta (CVD), which makes divergences and absorptions much easier to spot. This is one of the best ways to identify traps and prepare for reversals.
Open Interest and Delta: The Perfect Combination
OI and Delta on their own are powerful, but together they provide a complete market narrative:
- Price Rising + OI Rising + Positive Delta: Convincing uptrend, backed by new longs and strong buying.
- Price Rising + OI Declining + Positive Delta: Rally fuelled by short covering. Less sustainable.
- Price Declining + OI Rising + Negative Delta: Convincing downtrend, backed by new shorts and aggressive selling.
- Price Declining + OI Declining + Negative Delta: Sell-off fuelled by longs being stopped out. Often short-lived.
By unifying the two, you can see whether money is entering the market, and also who is driving it. This allows you to:
- Distinguish between true breakouts and fake pumps.
- Spot exhaustion before the trend reverses.
- Build context around any kind of setups, like the SFPs or ORB strategy.
Use Case 1: Bitcoin SFP with OI and Delta
Let’s walk through a practical example.
Bitcoin forms an SFP by taking out the previous weekly high. This prepares us for a potential drop.
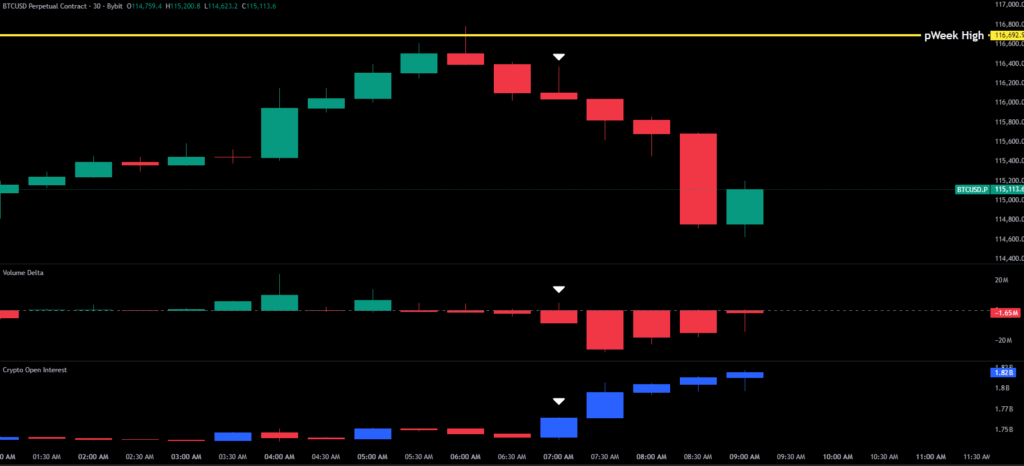
On the third 30-minute candle, OI rises while Delta turns negative. This signals a bearish context: sellers are aggressive, and new shorts are entering the market.
Now, the price begins to trend lower. Delta stays negative, showing sustained selling pressure, while OI confirms new shorts coming in.
This alignment (bearish candle + negative Delta + rising OI) increases the probability of new lows for the following sessions, and it’s precisely what we see in this example above.
Use Case 2: Bitcoin at ATH (OI + Delta)
Let’s take another real example.
On 14 August 2025, Bitcoin reached a new all-time high at $124K. Looking at our order flow template in ATAS, we can see that Open Interest stayed mostly flat during the move up. This gave us a neutral context, suggesting that the rally wasn’t being strongly supported by new longs.
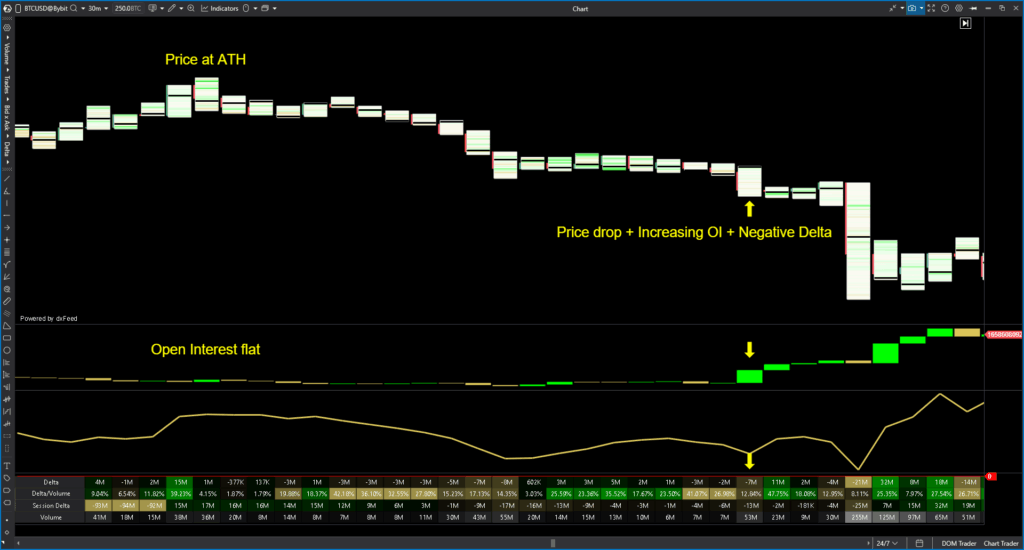
Price then began to retrace and moved back into the previous range. It wasn’t until Bitcoin reached the $120K level that we saw a clear shift:
- Open Interest started to rise,
- Volume increased,
- and Delta turned negative.
This combination significantly increased the probability of lower prices.
In other words, price acceptance back inside the prior range aligned with rising negative Delta and growing OI, showing that new shorts were entering the market. This provided strong evidence that sellers were taking control and that Bitcoin had a higher likelihood of moving to the downside.
Platforms for Reading Open Interest and Delta
To use OI and Delta, you’ll need a platform with order flow tools. Some of the best are:
- ATAS: professional order flow platform, excellent for futures.
- Quantower: powerful multi-asset trading platform with OI and Delta features.
- ExoCharts: order flow software popular among crypto traders.
- TradingView: recently added Open Interest and Delta indicators for crypto.
We have deals for every trading platform. Check them here.
On TradingView:
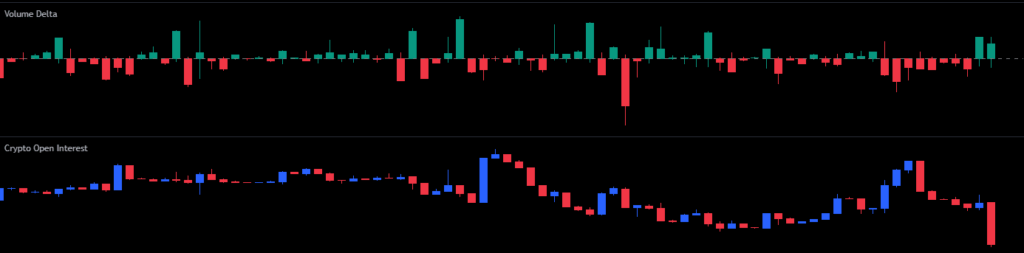
- Use the Open Interest or Crypto Open Interest indicators for OI.
- Use the Volume Delta indicator to track Delta per candle across BTC, ETH, XRP, and more.
For futures like ES and NQ, these tools are also available, though sometimes limited to daily and higher timeframes.
Conclusion
Open Interest and Delta are context tools that reveal the story behind price action. By combining them with your key levels of support and resistance, you can separate strong, sustainable moves from weak, short-lived ones.
Always remember:
- OI and Delta should not be used as entry triggers on their own.
- They vary from session to session, so wait for price to reach your level and then use them as an extra layer of confluence.
- Healthy trends are supported by rising OI and aligned Delta. Divergences or mismatches often reveal exhaustion or absorption.
At Chart Champions, we host live trading sessions where our coaches break down the markets in real time using order flow tools like Open Interest and Delta.
Join us live and learn how to apply these concepts directly to your trading.