Ever struggled to make sense of a chart that shoots up hundreds of percent? That’s where the logarithmic scale comes in.
At Chart Champions, we use log scale to spot price levels on charts that most traders miss entirely. It’s helped us pinpoint key zones and enter trades that turned out to be epic.
In this article, we’ll break down the top techniques for using log scale on TradingView, show you exactly when to turn it on, and share real examples using this advanced charting tool, so you can strengthen your own trading arsenal.
What Is A Log Scale in Trading?
The logarithmic scale, also known as log scale, shows that each vertical step on the price axis represents an equal percentage change rather than a fixed dollar value. A 10% move from $1 to $1.10 takes up the same space on the chart as a move from $10,000 to $11,000.
This proportional scaling helps preserve the integrity of historical data, allowing traders to compare past and current moves more fairly.
Log scale is especially useful when analysing long-term trends, multi-year price action, or assets with massive volatility, like cryptocurrencies or growth stocks.
In a linear scale, on the other hand, each vertical step on the price axis represents the same absolute amount of money.
Log Scale in Trading: Big Picture Clarity
Most traders use a linear scale on TradingView when analysing price action, regardless of whether an asset has moved hundreds or even thousands of percentage.
When an asset experiences large percentage swings over time, you’re dealing with a volatile chart. In these cases, tools like parallel channels or Fibonacci retracements on a linear scale can sometimes look exaggerated or distorted. The price action might even appear squished, giving you a misleading perspective.
This distortion can lead to poor trading decisions, incorrect Elliott Wave counts, and ultimately, missing key trades at important levels.
When Should You Use Log Scale?
The advantage of switching to a log scale is that it shows the chart based on percentage changes instead of raw price moves, giving a more realistic view of trends and patterns on the chart.
There are three key scenarios where using a log scale is highly effective:
- High Volatility Assets – when an asset moves hundreds of percent up or down.
- Historical Data Analysis – when looking at price data that spans several years.
- High Time Frame Perspectives – when you want a different or macro view of the market.
High Volatility Assets
If a chart moves 100%, 200%, or even 1000%, log scale will help you see proportional growth accurately. Think altcoins, growth stocks, or even meme tokens during bull markets.
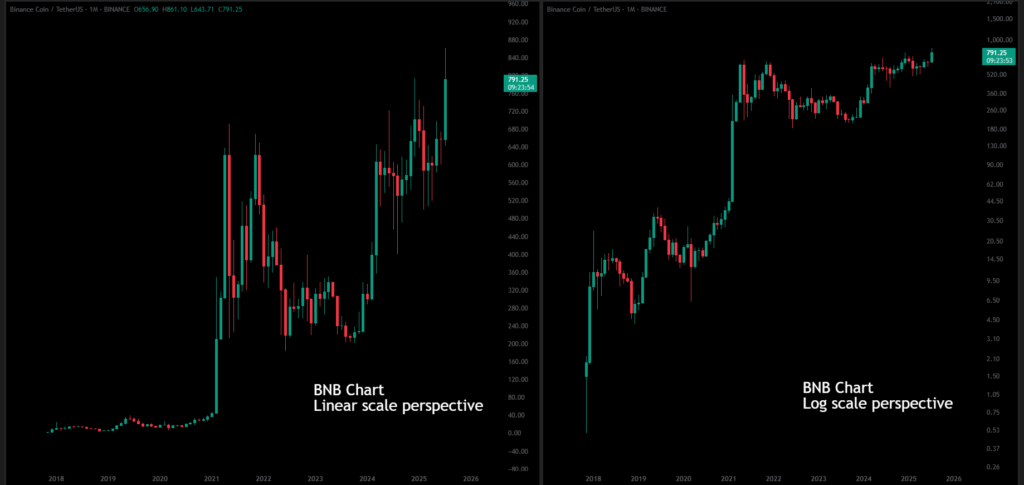
In the following example, we can see the BNB chart comparing the linear vs log scale perspective.
On a linear scale, the earlier price action is compressed, which slightly distorts the growth and volatility the asset has experienced since its launch.
Historical Data Analysis
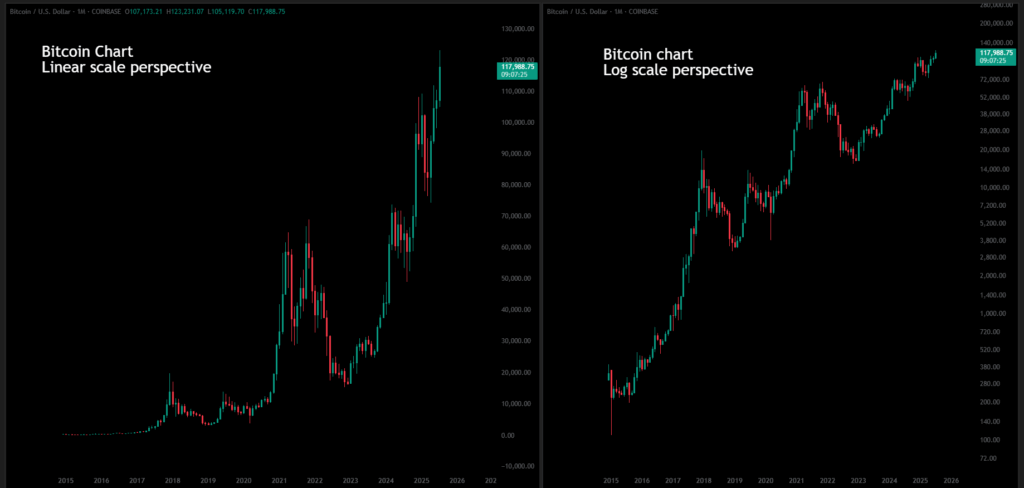
Looking at multi-year data? Log scale helps normalise past price actions so the early years aren’t visually compressed. This is especially useful for assets like Bitcoin, where early price action is crucial for Elliott wave count analysis.
Bitcoin is an asset that was launched in 2009. However, the chart with the longest available price history is from Bitstamp, which is widely used by Daniel for long-term analysis. Bitstamp provides data dating back to 2015, and with the log scale enabled, we can clearly observe the ‘waves’ in price action over time.
High Time Frame Perspectives
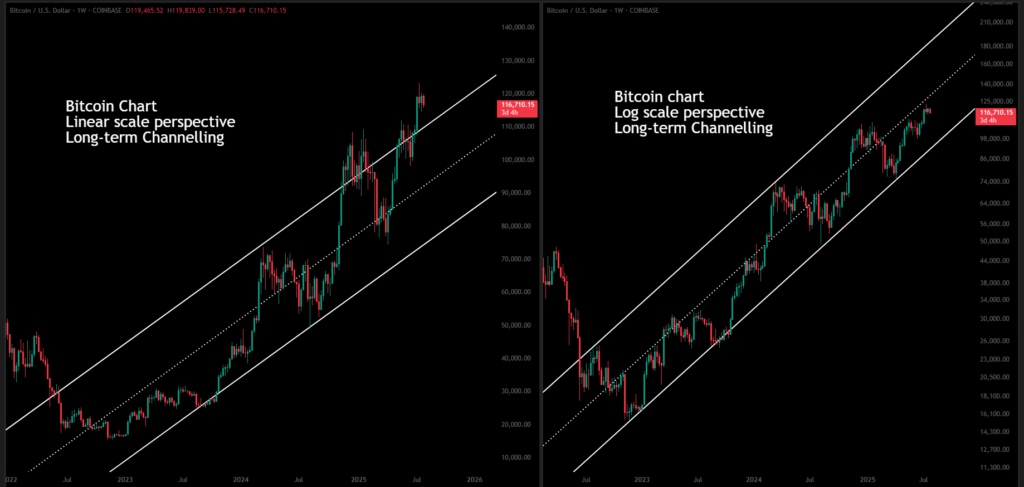
When you’re working with weekly, monthly, or even yearly charts, log scale gives you a cleaner view of long-term channels, Fibonacci levels, and Elliott Wave counts.
Without switching to log scale, it’s nearly impossible to clearly see and label major market structures on long-term charts.
The different perspective the log scale provides isn’t just about how the chart looks. It also has a direct impact on trade accuracy.
For example, by using log scale to build a channel and apply Fib extensions, we were able to predict the $42K top in Bitcoin and catch a short that led to a 30% drop. That setup wouldn’t have even shown up on a linear chart.
How to Apply Log Scale (The Right Way)
- You can enable log scale on TradingView by clicking the “L” button in the bottom right corner of the chart. When it’s on, the chart switches to a logarithmic scale; when it’s off, you’re back on a linear scale.
- If you’re using Fibonacci tools, make sure to tick the box that says “Fib levels based on log scale” in the settings. This ensures you’re getting the correct levels when analysing on a log chart.
- When analysing the big picture of assets like Bitcoin, we use the Bitstamp chart because it has the longest and most complete historical price data for BTC.
Only use log scale when relevant. Avoid using it for intraday or scalping setups, where the price changes are too small for the log scale to add value.
Pro Tip: Always switch to a linear scale when setting alerts on TradingView, as this ensures they trigger correctly.
Conclusion
Understanding when and how to use log scale in trading is a game-changer when working with volatile markets or analysing long-term price action. While most traders stick to linear charts by default, switching to log scale offers a new perspective of price movements based on percentage changes. But only when it’s used wisely.
Use this new perspective of log scale on charts to understand the historical context of the assets and sharpen the accuracy of Fib levels and Elliott wave counts.
At Chart Champions, we’ve seen firsthand how log scale can reveal powerful trade opportunities that most traders overlook. Now it’s your turn to level up your analysis.