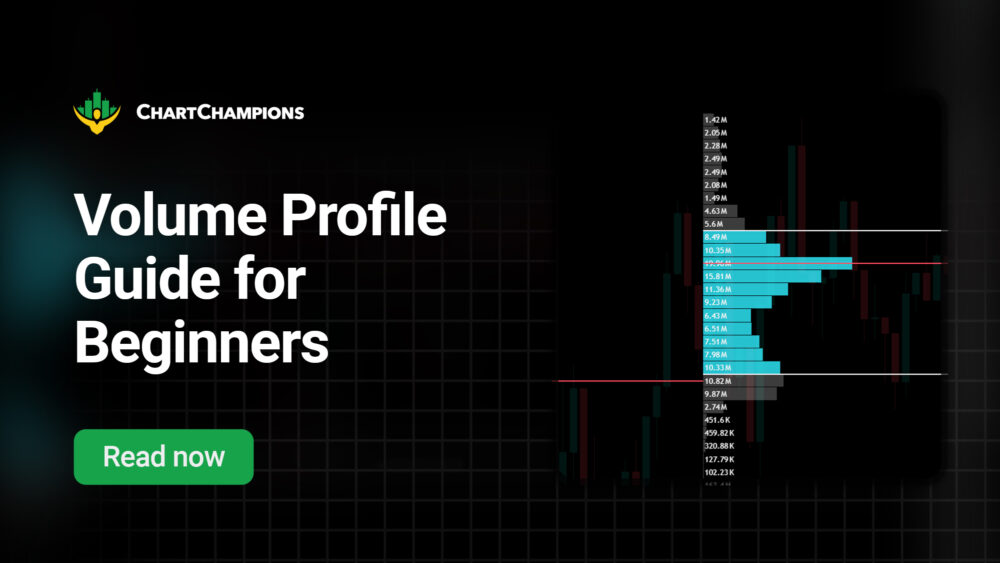
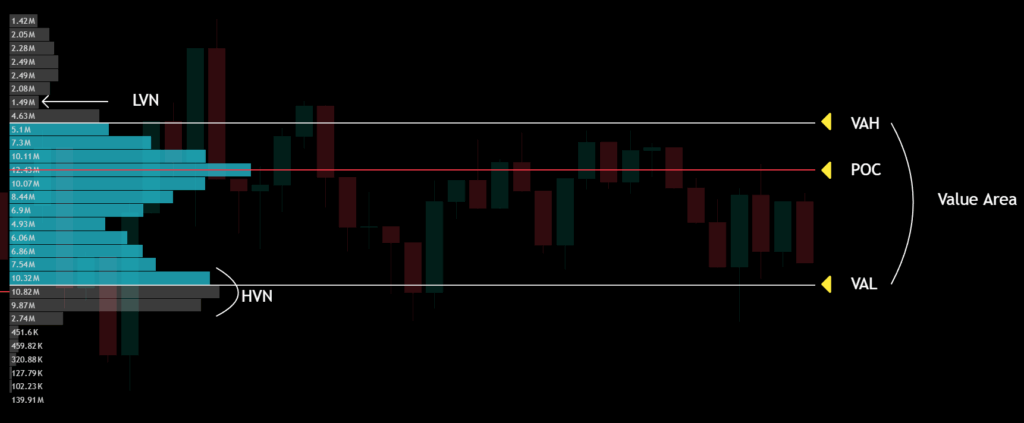
The three main components of the Volume Profile are the Value Area High (VAH), the Value Area Low (VAL), and the Point of Control (POC). Besides these, other critical elements such as High Volume Nodes (HVN) and Low Volume Nodes (LVN), along with profile shapes, help traders identify opportunities and shifts in market context.
Unlike the standard volume indicator in TradingView, which analyses volume based on time (X-axis), the Volume Profile displays volume horizontally at price levels (Y-axis). This helps traders better understand the strength of support and resistance.
Support and resistance levels can be daily, weekly, monthly, or derived from supply and demand. In this Volume Profile guide for beginners, we show you how the profiles complement any of these technical analysis methods effectively.
Essentials of Volume Profile
We have discussed the key elements of volume profile and the best tools available in TradingView. Let’s do a quick overview of the main elements:
- Value Area: 70% of traded volume.
- Value Area High/Low: Boundaries of the Value Area.
- Point of Control: Highest volume price level.
Other key elements of a Volume Profile are HVNs and LVNs, which, depending on the context, indicate price acceptance or rejection:
- Low Volume Nodes (LVN): An area of low traded volume, characterised by rapid price movements and market rejection. They are similar to single prints in Market Profile.
- High Volume Nodes (HVN): An area of high traded volume. Generally, suggesting market acceptance.
Each node is created based on the number of contracts traded within it. Unlike the POC, which is located within the Value Area, volume nodes can form either inside or outside the Value Area of a volume profile.
When we zoom in on the charts, we can clearly observe the volume traded within each node.
Trading HVNs and LVNs on a Volume Profile
At Chart Champions, we trade using previous-day Volume Profiles for day and scalp trading. For the following examples, we’ll be using the SVP indicator in TradingView; however, other platforms, such as Quantower and ATAS, are also suitable for this method.
High Volume Nodes in Practice
An HVN represents an area perceived by market participants as fair value. When the price revisits this area, it triggers a similar reaction, serving as solid support or resistance.
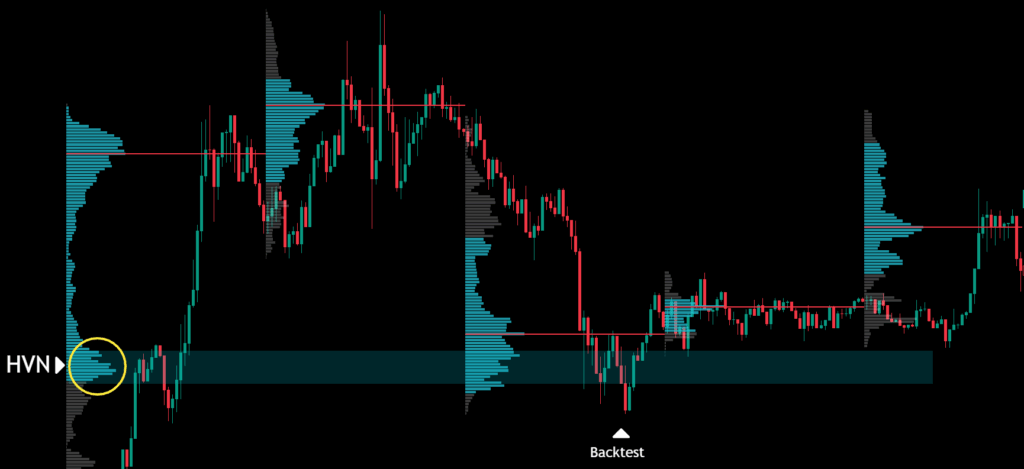
The HVN alone serves as a good area of support or resistance. Still, here we can see that it aligns with the VAL, increasing the probability of price reaction.
Two days later, the price revisits this zone, with the HVN acting as support. This level offered a bounce of at least 2%, ideal for day trading.
Low Volume Nodes in Practice
The LVNs are viewed as zones where price sprinted through so fast there wasn’t time for volume to build up. We use them to read the broader market context, but they aren’t standalone entry signals.
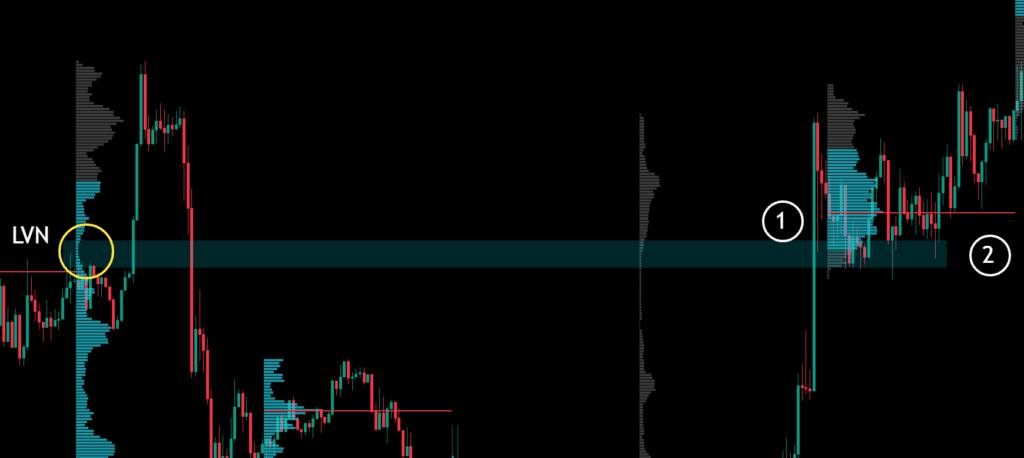
When we spot an LVN on a daily volume profile, we can expect the price to zip through that zone again because there’s no established volume there to slow it down (point 1).
However, if we observe fresh volume building over a previously tested LVN in a new daily profile, that indicates the market is starting to accept those higher prices (point 2).
Understanding Volume Profile Shapes
The Volume Profile is a distribution curve. Different shapes form around this distribution, each offering unique insights into the market context:
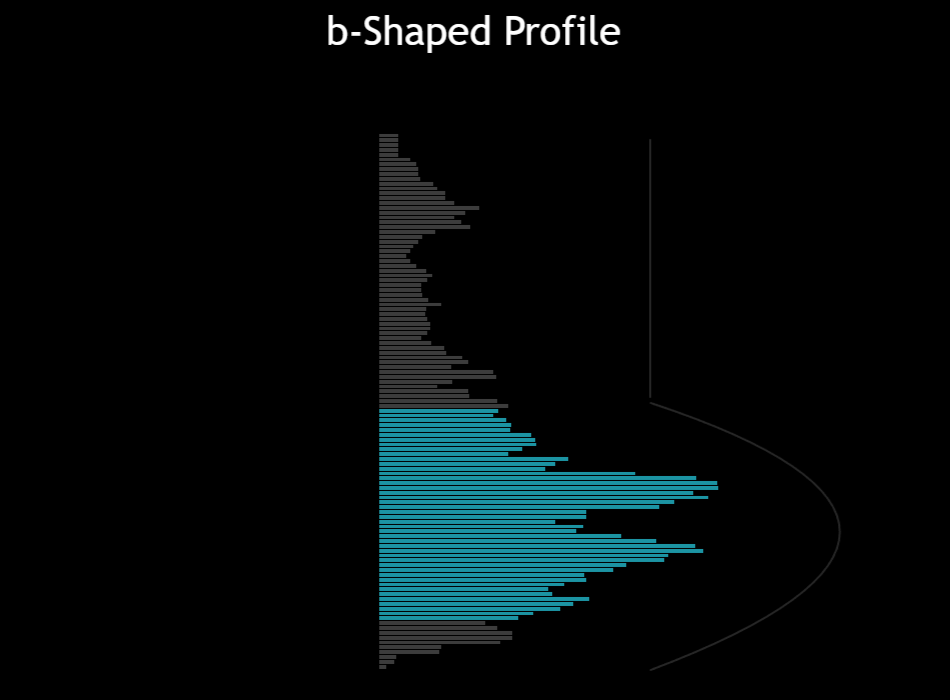
b-Shaped Profile
A b-shaped profile appears after a sharp decline, followed by consolidation, indicating a balance between selling pressure and market demand.
- Thin upper section: Low volume, price rejection.
- Wide bottom section: Equilibrium between buyers and sellers.
- Common in downtrends; signals potential reversal if seen in an uptrend.
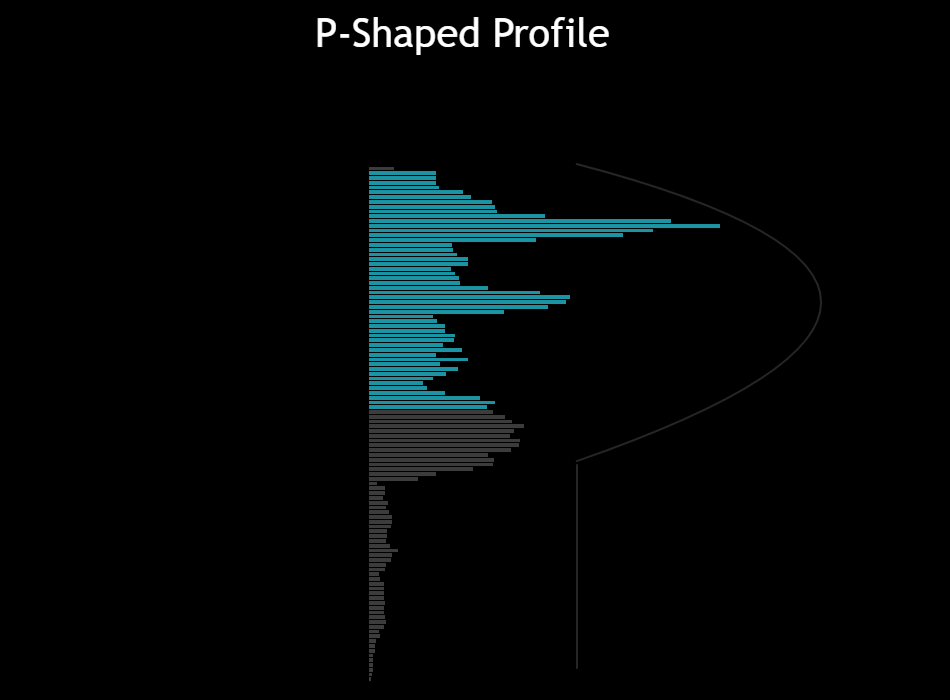
P-Shaped Profile
A P-shaped profile emerges after a sharp rise and subsequent consolidation, representing buying pressure or short covering.
- Thin lower section: Low volume, price rejection.
- Wide upper section: High trading activity, fair price.
- Usually bullish; may mark short-covering rallies at downtrend ends.
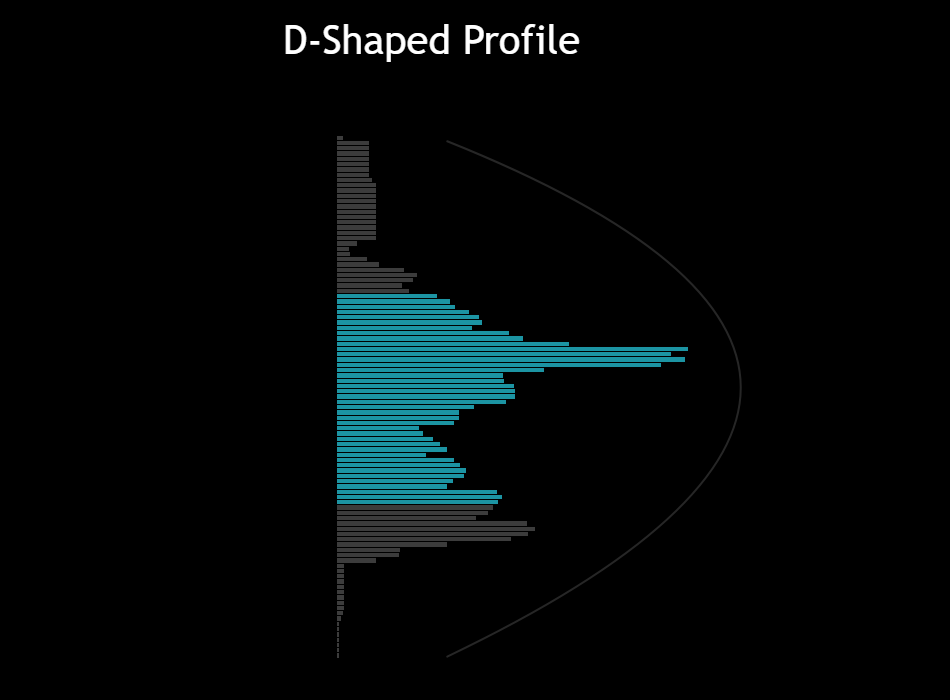
D-Shaped Profile
A D-shaped profile signals temporary market balance.
- Central POC: Equilibrium between buyers and sellers.
- Suggests a sideways market with a potential breakout scenario as institutions build positions.
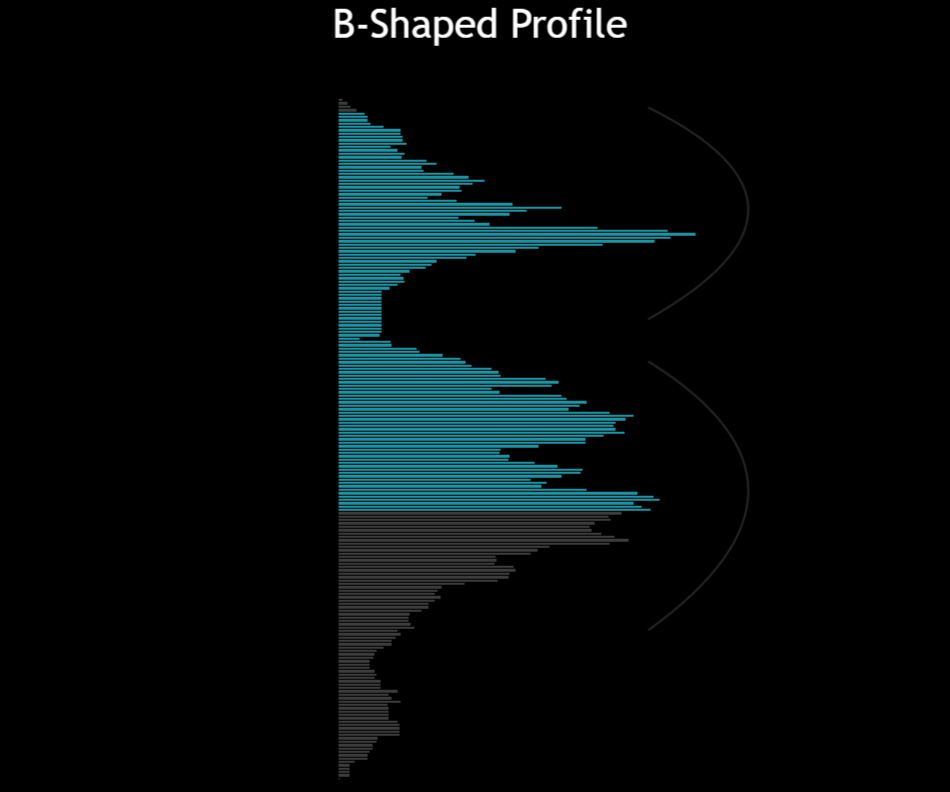
B-Shaped Profile
A B-shaped profile combines two D-shaped profiles within one timeframe.
- Indicates trend continuation.
- Important to identify the dominant POC for market direction insights.
Conclusion
This Volume Profile guide for beginners provides you with a clear roadmap: the Value Area (VAH–VAL) indicates where 70% of contracts trade, with the Point of Control marking the institutional “hotspot.” High Volume Nodes become your go-to support and resistance zones, while Low Volume Nodes flag the fast-moving lanes.
Add in the four profile shapes (b, P, D, B) to nail your directional bias. Plot HVNs and LVNs, and match the shape to your game plan, aligning every entry and exit with real supply and demand so you can trade smarter and with confidence.