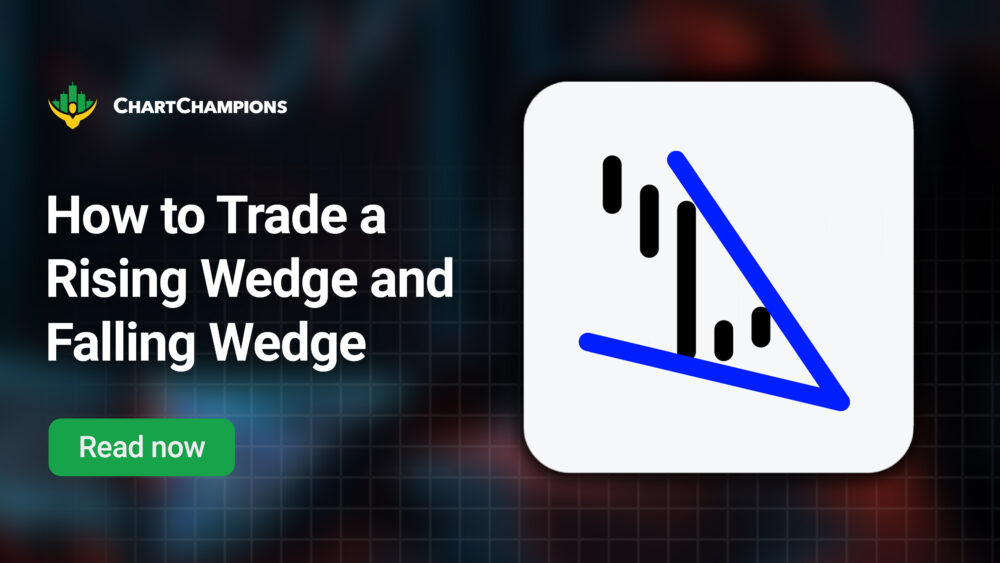
Wedge patterns are key technical analysis patterns found across all markets and timeframes. They’re handy for anticipating trend reversals. These patterns typically form during a trend when price action starts to slow down, creating a tighter range that converges into an apex shaped like an arrow.
Wedge patterns are among the most recognisable formations in trading, seen in forex, crypto, and stocks. In this guide, we’ll dive into the two most powerful types: the Rising Wedge and Falling Wedge.
You’ll also get practical tips and strategies for trading wedge patterns, enabling you to identify them confidently and utilise them effectively in your trading.
What are Wedge Patterns?
Wedge patterns are a type of chart pattern used in technical analysis to identify potential price reversals or continuations. They occur when the price action contracts between two converging trendlines. It can be either sloping upward or downward.
This pattern reflects a battle between buyers and sellers in a market that is slowing down after experiencing an impulsive trend. One of the most common characteristics of wedge patterns is that volume tends to decrease progressively throughout their formation.
There are two main types of wedge patterns in trading:
- The Rising Wedge
- The Falling Wedge
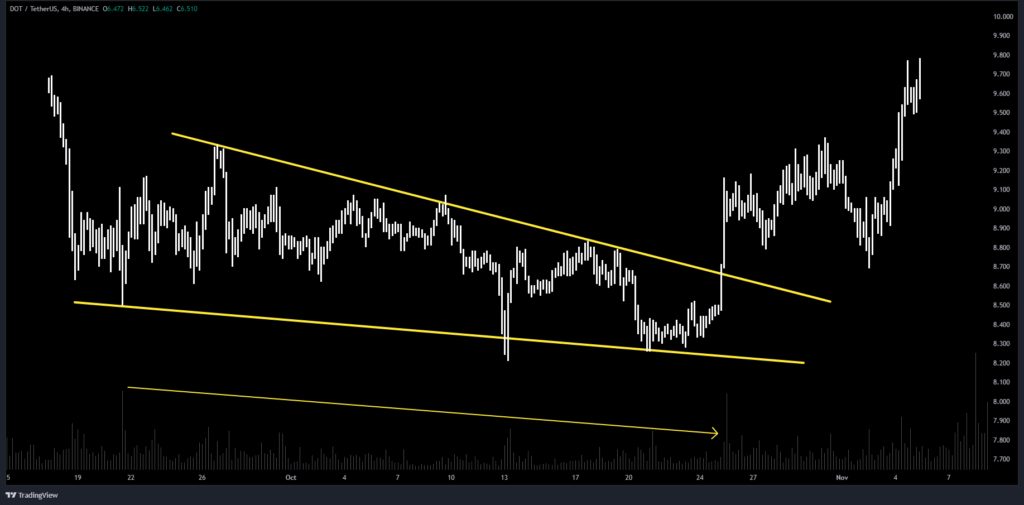
Both are classified as contracting patterns, meaning the range between highs and lows narrows over time. This tightening of price action signals a pressure buildup, often leading to a significant move once the price breaks out of the wedge.
We can observe wedge patterns in trading across all markets, including stocks, forex, and especially cryptocurrencies. They’re considered reliable because they give traders clear signals of where the price might be headed next, especially when combined with volume, support/resistance levels, and Fibonacci.
The Rising Wedge Pattern
A rising wedge pattern is a bearish chart formation that appears when the price makes higher highs and higher lows within a narrowing range. This creates two upward-sloping trendlines that converge, forming what looks like a triangle tilted upwards.
The key characteristic is that the slope of the support line (bottom trendline) is steeper than the resistance line (top trendline), showing that buyers are pushing the price up but with less and less strength.
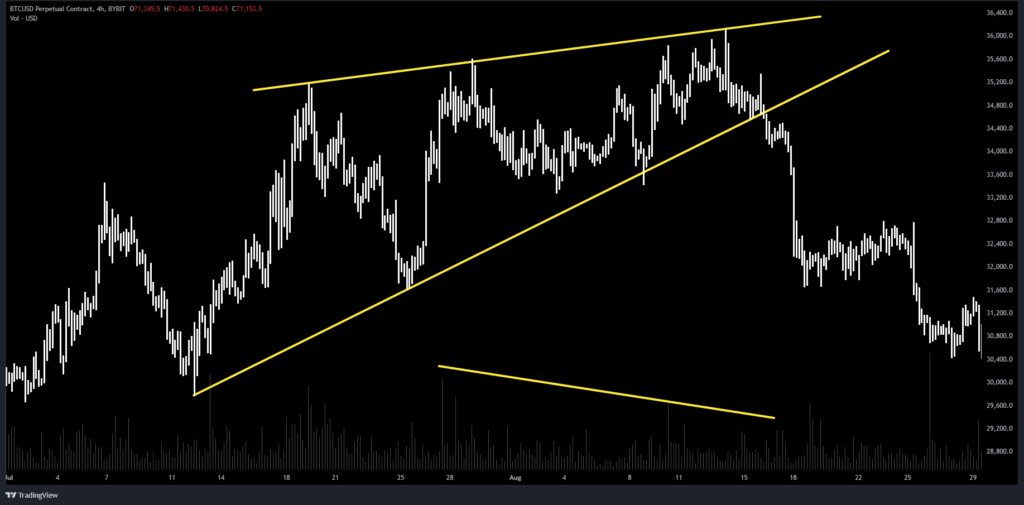
We want to see at least five touches: ideally three on the top trendline and two on the bottom.
This pattern usually contracts, so each upward impulse becomes smaller over time. This is a sign of a potential reversal.
Volume should decline as the price rises.
Rising Wedge in Uptrend vs Downtrend
- When a rising wedge forms in an uptrend, it’s typically seen as a bearish reversal pattern, indicating weakening momentum. This suggests that the uptrend may be losing momentum, and a breakdown could follow.
- When it forms in a downtrend, it often acts as a continuation pattern, indicating that the bearish trend will likely continue after a brief rally. There is a pause before continuation.
Despite the wedge’s upward direction, the pattern is usually bearish. Most rising wedges break to the downside, so many traders use them to anticipate potential shorting opportunities.
That said, context always matters in trading. Occasionally, a breakout to the upside can happen, but this is less common.
How to Trade a Rising Wedge Pattern
There are three ways to trade the rising wedge, depending on our risk appetite.
- Aggressive entry: short on the third touch of the top trendline.
- Conservative Entry: Wait for the support trendline to break and enter the short.
- Very conservative: Wait for a break and a retest of the support line before shorting.
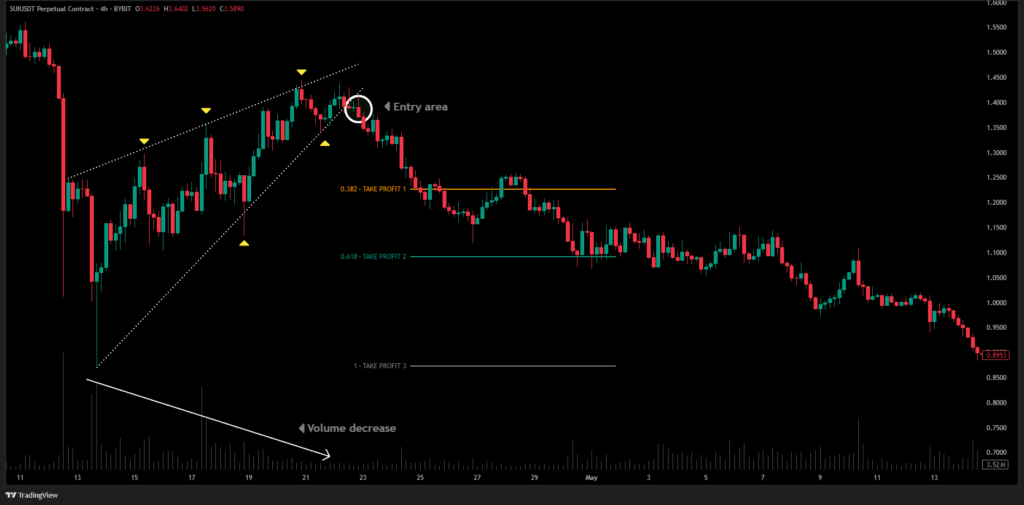
When the breakdown occurs, it is often followed by an increase in volume and a subsequent decline.
We generally use Fibonacci levels as targets for the rising wedge. We pull a Fibonacci from the beginning of the chart pattern all the way to the top, and use the following levels as targets:
- Target 1: 38.2% retracement.
- Target 2: 61.8% retracement (golden pocket).
- Target 3: Start of the rising wedge.
Extra Tips
- Look for bearish divergences in CVD.
- If volume increases during wedge formation, the pattern might be invalid, so avoid shorting.
The Falling Wedge Pattern
The falling wedge pattern is a bullish chart formation that appears when the price is making lower highs and lower lows, but within a narrowing downward channel.
It’s the opposite of the rising wedge and typically indicates that selling pressure is weakening, suggesting a potential bullish breakout may be forthcoming.
The key characteristics of a falling wedge pattern are two downward-sloping trendlines that are contracting. Sellers push the price down but with decreasing strength.
We aim for a minimum of five touches: typically three on the bottom and two on the top.
Price drops become smaller as it approaches the apex, and volume should decline throughout the pattern.
Falling Wedge in Downtrend vs Uptrend
- When a falling wedge forms in a downtrend, it’s typically seen as a bullish reversal pattern. The most common scenario is when the price breaks out upwards and starts a new trend.
- When it appears in an uptrend, it may act as a continuation pattern, signalling a pause before the bullish move resumes.
The falling wedge is generally considered bullish, even though the price action is trending downward while the pattern forms. It suggests sellers are losing control, and buyers might soon step in.
It’s essential to wait for a confirmed breakout above the resistance line before entering a trade.
How to Trade a Falling Wedge Pattern
There are three ways to trade the falling wedge, depending on our trading style and risk appetite.
- Aggressive entry: Buy on the third touch of the bottom trendline.
- Conservative Entry: Buy after the upper resistance trendline is broken.
- Very conservative: Wait for a break and retest of the resistance line before going long.
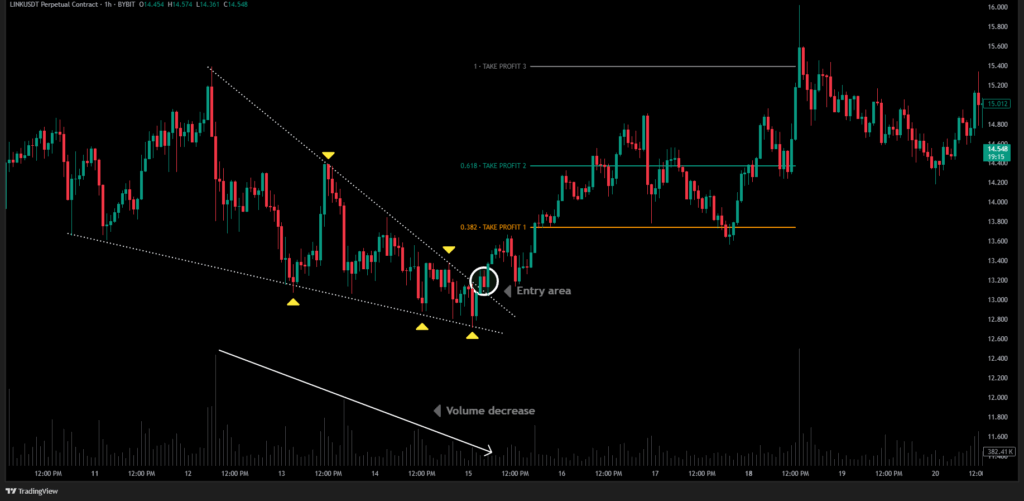
We can pull a Fibonacci from the top of the falling wedge to the bottom, and use the following levels as targets:
- Target 1: 38.2% retracement.
- Target 2: 61.8% retracement (golden pocket).
- Target 3: Start of the falling wedge.
Extra Tips:
- Look for bullish divergences in CVD.
- Ensure that the volume decreases as the wedge forms.
- If bearish volume is increasing, avoid longing.
How to Draw the Trendlines
- Connect at least two highs for the resistance line and two lows for the support line.
- The trendlines must converge into an apex.
- Small deviations or wicks are acceptable.
- Confirm with volume and price behaviour.
Conclusion
Rising Wedge and Falling Wedge patterns are powerful tools in any trader’s strategy. Learning to recognise these formations can help you anticipate key breakouts and reversals, whether you’re trading crypto, forex, or stocks.
Rising wedges often mean a down move is coming, while falling wedges can hint at a bounce. Both patterns become tighter over time, and the volume usually decreases as they form. The magic happens when you add context: watch volume, use Fibonacci for targets, and wait for that breakout or retest.
These patterns are simple but powerful. Once you learn to spot them, they can boost your trading confidence and decision-making.