Keeping your charts clean is a game-changer in trading, and the object tree in TradingView is your best ally for that. Cluttered visuals can cloud your decision-making, whether you’re analysing crypto, stocks, or futures.
The object tree lets us organise tools, drawings, and indicators for a smoother technical analysis experience. This guide shows you how to master it like a Champion.
Bonus: There is a surprise at the end!
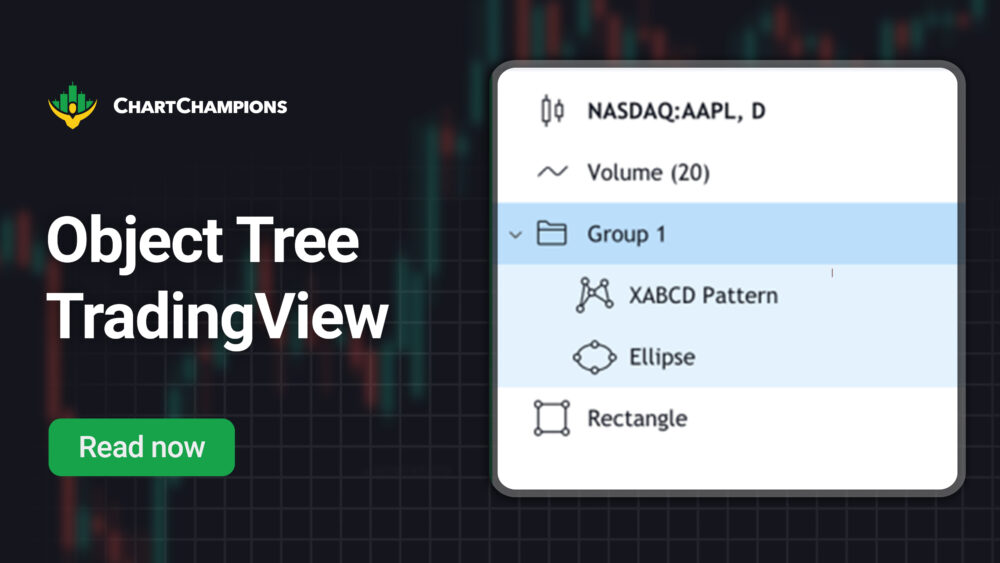
What is the Object Tree in TradingView?
The object tree is a built-in feature in TradingView that allows traders to view, manage, and organise all the elements they’ve added to their charts. Each chart has its object tree, which is accessed from the right-hand sidebar under the ‘Object Tree and Data Window’ icon.
Here is what you can do with the Object Tree:
- Organise drawings like trend lines, horizontal rays, Fibonacci tools, and fixed ranges.
- Group items into folders to categorise your technical analysis.
- Hide or lock elements to declutter your view and prevent accidental changes.
- Access the Data Window for precise OHLC values and volume info based on your selected timeframe.
Let’s be honest: Trading charts get messy fast. When all the moving averages, Bollinger Bands, Fibonacci retracements, support/resistance lines, and trend channels are activated, they can look like visual chaos.
The object tree becomes a valuable tool because it clarifies our charts so that we keep only what we need visible. We can also trade quickly and precisely by instantly finding and managing specific indicators or drawings.
If you have been following the Chart Champions course and free technical analysis on YouTube, you have likely seen the importance of a clean chart firsthand.
How To Use the Object Tree
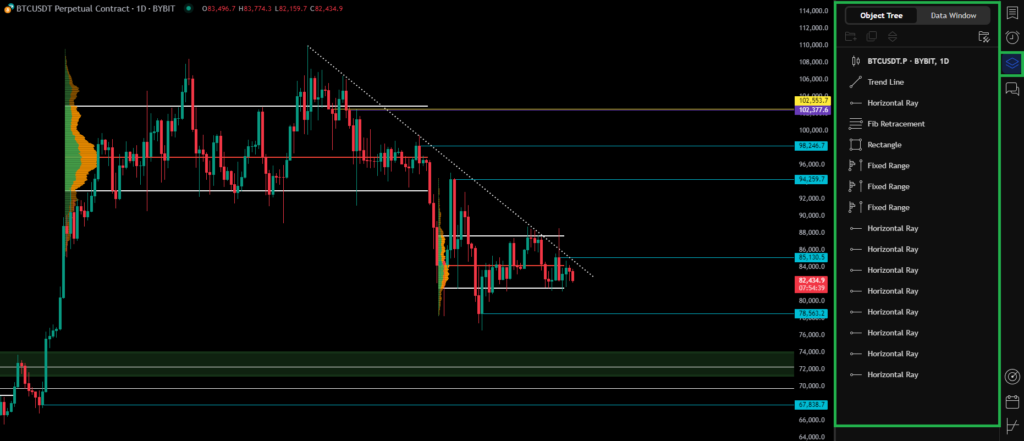
Add Drawing Tools
We will need to use drawing tools on our chart to get started. For this example, we have added the following drawings: horizontal rays, rectangles, trend lines, Fibonacci retracements, and Fixed-Range volume profiles.
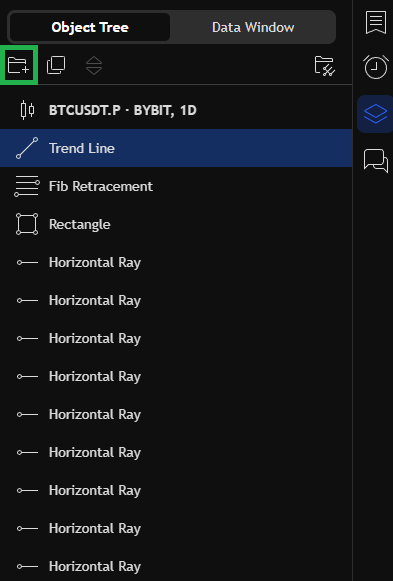
Create Folders
Organising our Technical Analysis into folders is a must. Once you have added drawings:
- Select a drawing
- Click the folder icon to create a new group
- Rename your folder (e.g., “Support and Resistance)
- Drag related drawings into the folder
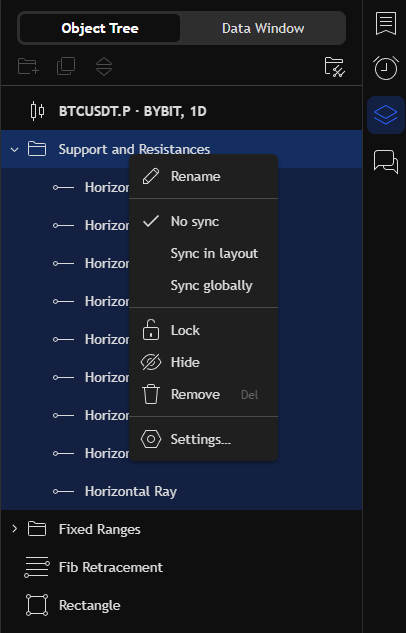
With our new folder ready, we can rename, lock, or hide it.
- Hide the folder to declutter. All the elements in that folder will be hidden, which is great for keeping a clear chart.
- Lock the folder to prevent mistakes so the drawings cannot be moved or deleted unless unlocked.
- Delete the folder to remove everything inside.
Categorise your Technical Analysis
At Chart Champions, we use various tools and indicators that help us categorise our technical analysis by type. For instance, if we use supply and demand, we can select all the related drawing tools and group them in a folder called “Supply and Demand”.
We generally use the following folder categories to keep a clean chart:
- Supply and Demand
- Support and Resistance
- High Time Frame Analysis
- Low Time Frame Setups
- Elliot Wave Counts (bullish/bearish)
- and more!
This level of organisation lets you toggle views based on context and keeps your workspace clean.
Bonus: Free TradingView Course from Chart Champions
If you want to go even deeper, Chart Champions offers a free TradingView lesson. Here is what you will learn:
- Managing assets in your watchlist
- Using toolbar favourites for speed
- Customising and saving indicator templates
- Setting up multi-chart layouts
- Tips for clean charting and reducing bias
Make sure you are logged in to access the trading course. Whether new to TradingView or refining your workflow, this course is a great add-on.
Mastering the object tree in TradingView helps us to organise our technical analysis and improve our edge. A clean chart leads to faster decisions, fewer mistakes and more confidence when trading.
See you inside!